

This Is a Major Buy Signal in Gold
Posted onYou’ve heard the saying that a picture is worth 1000 words? Investors and traders use “pictures” of market action to project where that market is going next.

Right now, the picture in gold is explosively bullish.
Gold is breaking out of a major basing pattern on the monthly gold chart that suggests an epic rally phase is starting.
A gold chart is simply a “picture” of historical price action. There are traders and investors who solely base their investing decisions based on so-called technical analysis. Here’s why.
There is an old market saying “It is all the in charts.”
That means that all known “fundamental factors” like concerns about an Iran-U.S. war, China-U.S. Trade War worries, fears about a stock market correction and everything else impacting gold is already “priced into the market.”
The three main tenets of technical analysis are:
- All known news is discounted in the current price of gold.
- Gold prices moves in trends.
- History repeats itself.
Every major Wall Street firm has a technical analysis research department and recommendations from the “chartists” are taken just as seriously as those who do macroeconoimc or “fundamental” research.
What are the charts saying about gold right now?
Explosive rally ahead!
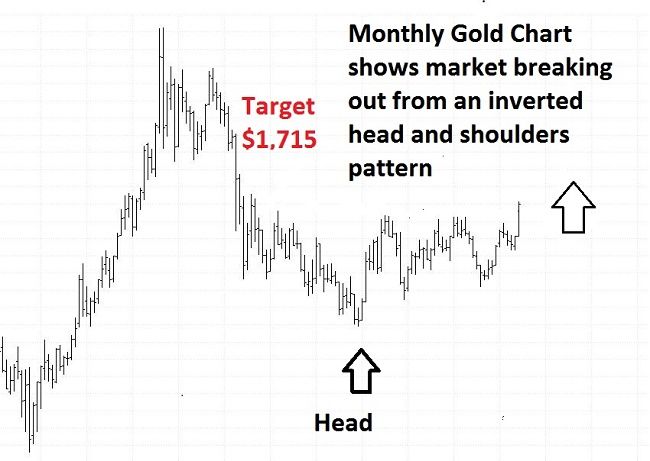
Gold just busted out higher with the close above the $1,400 level from a major “inverted head and shoulders” pattern. Funny name, but it’s a powerful pattern.
The “head” or bottom of the pattern formed around December 2015. The “shoulders” of the pattern marked the upper boundary of the trading range for the past six years. Last week, gold confirmed a bullish upside breakout from that pattern.
Patterns analysis works in markets because history repeats itself. People are the ones who trade and invest in financial markets. People are driven by emotions, including fear and greed, and those emotions unfold on the chart in the form of repeatable price patterns.
This gold market pattern also creates an upside target – around $1,715 per an ounce. That’s just a minimum objective, so gold could go much higher.
What’s next? As long as gold continues to hold above the $1,400 level, chart traders will be targeting gains to the $1,715 zone.
This is a veritable “buy signal” for gold. If you want to get on board this bullish investment, call Blanchard today at 1-800-880-4653 for personalized recommendations. Don’t wait. Next month, you will be paying much higher prices to get on board the gold market rally.


