

The #1 Leading Indicator for Gold Prices
Posted onBy David C. Zanca, Senior Portfolio Manager
Winter follows fall, and summer follows spring.
The seasons of nature act as a leading indicator for what comes next. After the leaves drop from the trees in September and October and the temperatures fall – winter follows. After months of snow and shorter days, warmer temperatures and longer days announce the arrival of spring.
In the economic realm, employment and consumer spending are considered leading indicators. These important data points signal whether the economy will grow or shrink in the months ahead.
Since the 2008 financial crisis, a leading indicator emerged for the price of gold. This gold signal offers a perfect and obvious timeline.
What is this leading indicator for gold prices, you wonder?
Let’s take a look at this chart of the price of gold from the St. Louis Federal Reserve. The red circles highlight key Fed actions we will describe below.
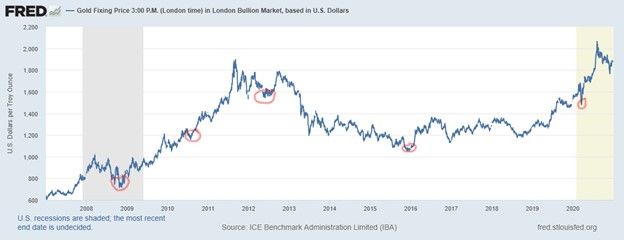
Fed Began QE1 in December 2008
In response to the Global Financial Crisis, the Fed announced a new program called Quantitative Easing (QE1) in late November 2008. The Fed stated it would purchase up to $600 billion in mortgage backed securities and agency debt.
Quantitative easing is a policy by the Fed in which they buy government bonds, corporate bonds and other assets in an attempt to inject liquidity into the economy and stimulate economic growth.
What did gold do? Gold bottomed just prior to this announcement at $731.50. By November of 2010 gold climbed to $1375 per ounce.
Fed Began QE2 in November 2010
In early November 2010, the Fed revealed it would purchase $600 billion of longer dated treasuries, at a rate of $75 billion per month. QE2 was announced in November 2010 and ran until June 2011.
What did gold do? During QE2 the price of gold soared from $1,375 to nearly $1,900.
Fed Began QE3 September 2012
In mid-September 2012, the Fed signaled it was launching yet another round of quantitative easing known as QE3. This new round included an open-ended commitment to buy $40 billion agency mortgage-backed securities per month in an effort to improve the labor market.
What did gold do? From a summer 2012 low around $1,600, gold climbed to nearly $1,800 in the fall of that year.
December 2015: First Fed rate hike in nearly a decade
Fed interest rates sat at 0% from December 2008 until December 2015.
In a historic move the Fed attempted to begin a new trend toward higher interest rates with a 0.25% basis point increase in the Fed Funds rate to 0.25-0.50%. In fact, at its December meeting, the Fed stated it planned to raise interest rates four times in 2016.
The stock market reacted violently to the removal of its punch bowl – and the Dow plunged over 2,000 points.
Investors knew the truth – the Fed would not be able to sustain interest rate hikes and begin to remove liquidity from the financial system.
What did gold do? In December of 2015 gold bottomed out at $1,070 per ounce. Gold began to climb in value right after the rate increase as the stock market plunged. Within a few months, the Fed backed away from its claims of continued interest rate hikes. Gold rose $300 per ounce over the next four months.
Bottom line: Zero percent interest rates have become an ingrained and integral part of our financial system, which allows the stock market bubble to perpetuate.
March 2020 – Fed’s emergency COVID actions
The Fed unleashed a historic and unprecedented round of monetary actions in March 2020 aimed at stemming the economic reaction to the COVID pandemic. The Fed slashed interest rates to 0% once again, announced new corporate bond purchases and printed trillions of new dollars throughout the year.
The Fed became both the buyer of last resort and the seller of last resort through emergency actions that ultimately devalued the fiat currency and pushed the U.S. dollar index lower by 10% last year. Overall, the Fed expanded its balance sheet by nearly $3 trillion in 2020 to a record $7.4 trillion.
What did gold do? Gold rallied to a new all-time record high at nearly $2,070 per ounce in 2020 – fueled by the Fed’s massive money printing, QE policies.
What is the number one leading indicator for gold prices?
It is easy to conclude that it is Federal Reserve quantitative easing policy.
The timeline we’ve discussed today reveals a direct connection between the Fed’s loose monetary policy and quantitative easing and a steady rise in the price of gold.
What’s next for gold? Heading into 2021, the Fed and the government appear poised to deliver more of the same – 0% interest rates and more quantitative easing.
Congress passed a new COVID emergency stimulus bill in December, which simply means more quantitative easing. Many expect more emergency stimulus in 2021 as well.
Using history as our guide, these forces will drive gold higher and higher in the months ahead. These Fed policies act as a leading signal for gold and indicate higher prices ahead. The Fed has already stated it won’t even consider raising interest rates in 2021. Do you own enough?
Want to read more? Subscribe to the Blanchard Newsletter and get our tales from the vault, our favorite stories from around the world and the latest tangible assets news delivered to your inbox weekly.


