


The Forgotten Masterpiece: The Story of the 1936 Columbia, South Carolina Sesquicentennial Half Dollar
Posted on — Leave a commentA Celebration Cast in Silver

Some coins commemorate presidents. Others honor military victories, world expositions, or great moments in American history.
Then there are coins like the 1936 Columbia, South Carolina Sesquicentennial Half Dollar.
At first glance, it may seem like just another silver commemorative from the 1930s. Yet behind its intricate design lies a fascinating story of state pride, artistic controversy, congressional politics, and one of the most remarkable collecting booms in American numismatic history.
Released during the height of the classic commemorative era, the Columbia Half Dollar celebrates the 150th anniversary of the designation of Columbia as South Carolina’s capital city. Today, nearly ninety years after its release, it remains one of the most attractive and historically significant coins of the entire commemorative series.
Its story begins long before the coin itself was struck.
Why Columbia Became South Carolina’s Capital
In the years immediately following the American Revolution, South Carolina faced a challenge shared by many young states. Charleston served as the capital, but its location on the coast made it inconvenient for residents living inland.
Travel was difficult. Roads were primitive. Political leaders increasingly believed the state’s government should be located closer to its geographic center.
In 1786, the South Carolina General Assembly selected a site near the confluence of the Broad and Saluda Rivers to become the state’s new capital. Unlike many American cities that evolved organically over decades, Columbia was deliberately planned from the beginning.
Wide streets, organized blocks, and public spaces reflected the optimism of a new nation still defining itself. Columbia became one of America’s earliest purpose-built capital cities.
Over the next century and a half, the city grew into the political and cultural heart of South Carolina. By the 1930s, local leaders sought a fitting way to commemorate the 150th anniversary of that historic decision.
A commemorative coin seemed like the perfect choice.
The Great Commemorative Coin Boom
To understand the Columbia Half Dollar, it helps to understand the era in which it was born.
The mid-1930s represented the peak of America’s classic commemorative coin movement. Congress authorized dozens of commemorative issues between 1892 and 1954, but no year was busier than 1936. Communities across the country sought commemorative coins to celebrate anniversaries, historical figures, expositions, and local milestones.
Collectors eagerly purchased every new release. Coin clubs flourished. Numismatic publications expanded. Demand for commemorative coins reached unprecedented levels.
In 1936 alone, collectors saw issues honoring the Oregon Trail, Texas Centennial, Bay Bridge, Albany Charter, Elgin Centennial, Bridgeport Centennial, Long Island Tercentenary, and many others.
The Columbia Sesquicentennial Half Dollar entered the market at precisely the moment collectors were most enthusiastic about commemorative coinage.
On March 18, 1936, Congress passed legislation authorizing 25,000 silver half dollars to commemorate the 150th anniversary of Columbia becoming South Carolina’s capital. The proceeds would help support the city’s sesquicentennial celebration.
The Young Sculptor Who Refused to Quit
Most commemorative coins of the era were designed by established artists with national reputations.
The Columbia Half Dollar took a different path.
The Columbia Sesquicentennial Commission selected Abraham Wolfe Davidson, a young sculptor associated with Clemson College, to create the coin’s design. Davidson was talented, ambitious, and deeply committed to the project.
His selection immediately created friction. The Commission of Fine Arts, which reviewed proposed coin designs, strongly criticized Davidson’s original models. Officials questioned the artistic quality of his work and suggested substantial revisions. At one point, there were discussions about replacing him entirely. Davidson refused to walk away. Instead, he revised his designs, worked through criticism, and continued refining his vision until approval was finally granted in July 1936.
The result would become one of the most distinctive commemorative designs of the decade.
A Design Filled With Meaning
Unlike many commemorative coins that focus on a single portrait or event, the Columbia Half Dollar tells a layered story through symbolism.
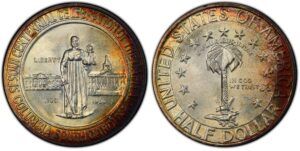
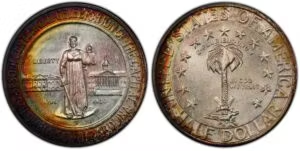
The obverse features a standing figure of Justice holding scales and a sword. She stands between Columbia’s original State House and the modern State House, symbolizing the city’s evolution from a frontier capital to the center of South Carolina government. This is not simply a city anniversary. It is a celebration of government, civic progress, and the enduring role Columbia has played in South Carolina’s history.
The reverse is the palmetto tree, one of South Carolina’s most recognizable symbols. The palmetto represents the state’s Revolutionary War heritage after palmetto-log fortifications helped absorb British cannon fire during the defense of Sullivan’s Island. Below the tree rests a broken oak branch, representing British defeat and American resilience. Arrows tied together symbolize strength through unity, while thirteen stars surrounding the tree honor the original thirteen colonies.
Every element contributes to a larger narrative about independence, state identity, and national unity.
Three Mints, One Coin, Endless Excitement
The legislation authorizing the Columbia Half Dollar included language allowing production at multiple United States Mint facilities. Meaning instead of a single commemorative coin, they would have an opportunity to assemble a three-coin set featuring examples from Philadelphia, Denver, and San Francisco.
The final mintages totaled approximately 9,007 coins from Philadelphia, 8,009 from Denver, and 8,007 from San Francisco, including assay pieces. None were melted, meaning virtually the entire authorized mintage entered the collector market.
The commission sold individual coins for $2.15 or complete three-coin sets for $6.45. At a time when many Americans were still struggling through the Great Depression, those prices were steep. Collectors nevertheless lined up with excitement to buy them.
Frustrating Dealers and Creating Demand
The Columbia Sesquicentennial Commission took an unusual approach to distribution.
Rather than allowing large dealers to acquire substantial quantities, the commission limited purchases in an effort to prevent speculation and distribute the coins more broadly among collectors.
The strategy worked—but not everyone was happy about it.
Collectors appreciated the opportunity to obtain coins directly. Dealers, however, often complained that acquiring inventory became unnecessarily difficult.
The controversy reflected a larger issue facing commemorative coin programs during the 1930s.
As more commemorative issues entered the market, debates emerged about mintages, distribution practices, and the growing influence of speculation.
Ironically, those very debates helped make classic commemorative coins one of the most fascinating areas of American numismatics today.
A Snapshot of 1930s America
The Columbia Half Dollar represents more than a city anniversary. It serves as a snapshot of America during the Great Depression. Despite economic hardship, communities across the nation continued celebrating their history. Local leaders recognized that historical anniversaries could strengthen civic pride, attract visitors, and remind Americans of the resilience that had carried previous generations through difficult times.
The Columbia Sesquicentennial celebration reflected that spirit. It connected citizens of the 1930s with the optimism of 1786, when South Carolina’s leaders envisioned a new capital city in the heart of the state.
The coin transformed that connection into something tangible, a piece of history that could be held in the hand.
Why the Columbia Half Dollar Still Matters
Some coins become famous because they are rare. Others become famous because they are expensive.
The 1936 Columbia Sesquicentennial Half Dollar endures for a different reason.
It tells the story of a young nation establishing new centers of government. It tells the story of South Carolina’s growth over 150 years. It tells the story of artistic perseverance in the face of criticism. And it tells the story of one of the most exciting periods in American coin collecting.
For collectors, these connections are what make classic commemorative coins special. They are more than silver and more than mintage figures. They are miniature historical documents preserved in metal.
The Columbia Half Dollar may not receive the same attention as the Oregon Trail Memorial Half Dollar or the Texas Centennial Half Dollar, but that only adds to its appeal.
It remains one of the hidden gems of the classic commemorative series, a beautifully designed reminder that America’s history is often found in places collectors least expect.
Fed stands pat on interest rates—gold surges on the news
Posted on — Leave a commentFederal Reserve Bucks 1-3 Odds of Rate Hike Today
Under the leadership of new Federal Reserve Chairman Kevin Warsh, the central bank held its benchmark interest rate steady in the 3.5%-3.75% range today. Wall Street traders had estimated there was a one-in-three chance the Fed would hike interest rates to fight back against still-high inflation that has been worsened by the war raging in the Middle East.
Three members of the Fed dissented in today’s decision, instead wanting a quarter-point interest rate hike. Chairman Warsh was not one of them. The three dissents reveal that some on the Fed committee are running out of patience with too-high inflation that has been painful for everyday Americans at the gasoline pump and the grocery store.
Markets React
Gold immediately after the Fed news and has been trading steadily to higher in recent weeks, trading above the key $4,000 level. Gold gained because bullion benefits from a steady to lower interest rate environment as the metal pays no interest. In other markets, the U.S. dollar sank sharply, and stocks pared earlier losses slightly following the Fed news.
Inflation Above Fed’s Target for Five Years Now
Pressure has been building on the central bank to hike interest rates to battle still-high inflation in the U.S. However, the most recent June consumer price index (CPI) revealed a modest 0.4% decline to a 3.5% annual rate. The slight drop in inflation last month provided “cover” for those on the Fed who don’t want to raise interest rates. But, despite June’s small drop in CPI inflation, the annual rate has stood well above the Fed’s 2% inflation target for over five years now.
The U.S. war in Iran, now entering its sixth month, has boosted energy prices, which in turn have sent consumer prices higher this summer. The price of a gallon of gas now averages $4.09 in the U.S.—and that’s up sharply from a year ago at $3.13, according to AAA. Higher energy costs affect the price of nearly everything in the economy from milk to televisions to clothing. Goods are often transported using trucks, and the higher transportation costs generally get passed along to consumers.
Chairman Warsh Remarks
At a post-Fed meeting press conference, Chairman Warsh reaffirmed the Fed’s commitment to a 2% inflation target. He also told reporters that the “economy is showing impressive resilience” and even with recent shocks, trends are positive.
Key takeaway?
Today’s inaction by the Fed reveals growing soft power by the new Chairman. It remains to be seen whether or not Warsh can hold off on rate hikes later this year. Wall Street will be watching the upcoming inflation and jobs reports closely for clues. The new Fed Chairman has stated the central bank will be giving less “forward guidance” to markets on where interest rates will go next. That leaves the door open for market volatility as investors are less prepared for what may come next.
Big Picture for Gold?
While the correction phase in gold recent months may have been unsettling for some investors, Wisdom Tree called it “a healthy reset rather than the end of the structural bull market,” in a July research note to clients.
Wall Street firms by and large remains positive on the outlook for gold ahead. This week, State Street Investment Management predicted that the next $1,000 move in gold will likely be higher. UBS forecasts gold to jump to $5,200 by mid-2027.
Gold has built a base above the $4,000 level. The next big move is expected to be higher. If you’ve been waiting for the right time to increase your allocation to precious metals—this is it. Don’t wait too long to take action. Before you know it gold could be $300, $500 or even $1,000 higher than it is today.
Inside the Platinum Coin Market: From the American Eagle to the Maple Leaf
Posted on — Leave a commentPlatinum is thirty times rarer than gold. This scarcity defines the platinum coin market, where annual production measures in thousands rather than millions of pieces. Government mints began striking platinum bullion in the late 1980s, responding to investor demand for this industrial and precious metal. Today’s platinum coin market centers on a handful of government-issued programs offering investment-grade purity in multiple fractional sizes. This article examines platinum coins from major government mints, how platinum compares to gold and silver, and practical strategies for adding platinum to investment portfolios.
Understanding Platinum as a Precious Metal
Platinum occupies a unique position among precious metals, combining industrial utility with investment demand and extreme rarity. Watch this documentary to learn more about platinum’s mining, industrial applications, and historical significance.
Platinum’s Unique Properties
Industrial Applications and Baseline Demand
Platinum’s catalytic properties allow it to convert harmful vehicle emissions into less toxic gases without being consumed in the process. This makes platinum essential in catalytic converters, which maintain demand for the metal regardless of investment sentiment. Automotive manufacturing consumes roughly 40% of annual platinum production. When car sales decline during recessions, platinum prices typically fall more sharply than gold. Jewelry production and specialized manufacturing applications including petroleum refining and electronics add additional demand that supports floor prices but increases price volatility compared to monetary metals.

Image: Automotive catalytic converter containing platinum catalyst
Source: Schmidt’s Auto Recycling
Rarity and Mining Production
Platinum occurs in commercially viable concentrations in only a few locations worldwide. South Africa’s Bushveld Complex contains the world’s largest deposits, producing approximately 70% of global supply, while Russia’s Norilsk region provides most remaining production. Annual platinum production totals roughly 6 million ounces compared to approximately 100 million ounces of gold, making platinum genuinely thirty times scarcer by mining output.

Image: Platinum mining operations at Chernogorskoye deposit in Siberia
Source: Mining.com
Investment Characteristics
Platinum prices demonstrate higher volatility than gold due to smaller market size and stronger industrial demand correlation. Economic downturns affect platinum more severely than gold since automotive and manufacturing demand declines impact prices alongside investment flows. This volatility creates both risk and opportunity for investors.
Purity Standards
Government platinum bullion maintains .9995 fineness (99.95% pure), an exceptionally high and consistent standard across all major minting programs. This near-absolute purity ensures uniform metal content whether buying a platinum Eagle coin, Canadian Maple Leafs, or other government-issued platinum.
Platinum vs. Gold and Silver
Supply Concentration
Platinum’s geographically concentrated production creates supply vulnerability that gold and silver avoid through more diversified global mining. Labor strikes or political disruptions at major mines can significantly reduce global supply, affecting prices rapidly.
Historical Price Relationships
Platinum historically traded at premiums to gold, reflecting its industrial utility and extreme rarity. However, economic downturns invert this relationship when automotive production collapses and investors flee to gold’s safe-haven stability. These periodic inversions create tactical opportunities for investors monitoring relative valuations between the two metals.
Market Liquidity Considerations
The platinum investment market remains substantially smaller than gold or silver markets. Fewer dealers maintain large platinum inventories, and bid-ask spreads typically exceed those for gold. 1 oz platinum coin value tracking remains more straightforward than fractional sizes due to higher trading volumes, though liquidity still lags behind gold. This reduced liquidity affects both purchase premiums and resale ease.
Portfolio Diversification Role
Platinum provides diversification within precious metal holdings through its distinct demand drivers. Industrial exposure offers different economic sensitivity than gold’s monetary role, while platinum’s scarcity provides rarity characteristics exceeding even gold.
American Platinum Eagle Coin: The U.S. Mint Flagship
The United States Mint introduced platinum bullion in 1997, establishing the platinum American Eagle coin as the nation’s official platinum investment coin.
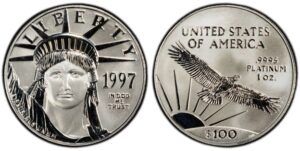
Image: 1997 American platinum Eagle coin obverse and reverse showing first year of issue
Source: PCGS
Program History and Background
Launch and Legal Tender Status
Congress authorized platinum Eagles in 1996, with production beginning the following year. These coins carry legal tender face values from $10 to $100 depending on size, though their platinum content determines actual market value. The face value designation distinguishes government-issued bullion from private mint rounds.
Bullion and Proof Programs
The U.S. Mint produces two distinct platinum Eagle versions. Bullion strikes serve investors seeking precious metal content at lower premiums than proof editions, featuring consistent designs year to year. Proof versions target collectors with mirror finishes, changing reverse designs annually, and substantially higher premiums over platinum spot prices.
Production Interruptions
Unlike gold and silver Eagles with continuous production since their launches, platinum Eagles experienced multiple suspensions. US Mint platinum coin mintages dropped to zero during 2009-2013 and again from 2015-2017, primarily due to platinum planchet supply constraints. These interruptions created scarcity for specific years, affecting collectible premiums.
Design Elements
John Mercanti’s Statue of Liberty portrait dominates the obverse across all platinum Eagle sizes. Bullion versions feature a consistent reverse showing an eagle soaring over a sunrise with rays. Inscriptions include “UNITED STATES OF AMERICA,” weight (“1 OZ. PLATINUM” or fractional equivalent), “.9995 PLATINUM,” and face value denomination.
Fractional Sizes and Specifications
Platinum Eagles are struck in four sizes: the 1 oz platinum coin ($100 face value), 1/2 oz ($50), 1/4 oz ($25), and 1/10 oz ($10). All maintain .9995 fine platinum content. The U.S. Mint produced fractional sizes sporadically, with 1/10 oz platinum coin pieces more consistently available than 1/2 oz or 1/4 oz options.
The Canadian Maple Leaf Platinum Coin
The Royal Canadian Mint pioneered platinum bullion coinage in 1988, predating the American Eagle platinum coin by nine years.
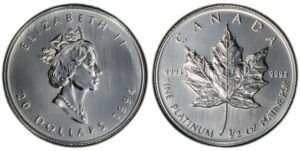
Image: 1994 half-ounce Canadian Maple Leaf platinum coin obverse and reverse
Source: PCGS
Royal Canadian Mint Production
Program Launch and Design Consistency
Canada’s platinum Maple Leaf debuted in 1988 as the world’s first .9995 fine platinum coin, establishing the purity standard that American and other mints would later adopt. Unlike proof platinum Eagles with annually changing reverses, Maple Leafs maintain the iconic maple leaf design introduced at launch, providing visual consistency that collectors and investors recognize immediately.
Security Features and Availability
Recent platinum Maple Leafs incorporate radial line patterns on both obverse and reverse surfaces, creating visual texture that deters counterfeiting. Micro-engraved security elements add authentication features without affecting the coin’s platinum content or dimensions. Production volumes remain modest compared to gold and silver Maple Leafs, with annual mintages typically measured in thousands rather than hundreds of thousands of pieces.
Technical Specifications
Platinum Maple Leafs contain .9995 fine platinum in a standard platinum 1 oz coin size measuring 30mm diameter. The Royal Canadian Mint occasionally produces fractional weights but focuses primarily on one-ounce coins. Each carries $50 Canadian legal tender face value, though platinum content determines actual market worth. The consistent specifications across production years simplify authentication and trading.
Other Notable Platinum Coins
Beyond the American Eagle platinum coin and Canadian Maple Leafs, several mints produce platinum bullion with varying availability and collector appeal.
Australian Platinum Issues (Perth Mint)
Perth Mint has produced multiple platinum bullion and collectible programs over the years, not limited to a single design. While platinum production is sporadic, the mint has issued platinum versions of iconic Australian series including the Platypus, Koala, and Kangaroo, often in limited quantities and with changing designs across different years. Among these, the platinum Platypus coin is one of the best-known modern issues, featuring annually changing designs that distinguish it from the consistent imagery used on Maple Leafs.
Lower mintages across Perth Mint platinum programs create numismatic interest beyond metal content, with premiums often exceeding standard bullion pricing. Because platinum issues are released irregularly rather than annually, availability varies significantly, and specific years can become difficult to acquire on the secondary market.
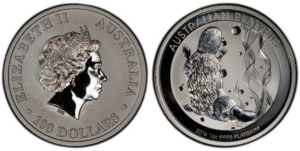
Image: 2016 Australian platinum Platypus coin obverse and reverse from Perth Mint
Source: PCGS
International Platinum Programs
Several mints outside North America produce platinum bullion coins that offer investors additional design options but typically with more limited availability. Austria’s platinum Philharmonic represents Europe’s most established platinum bullion coin, featuring the Vienna Philharmonic’s orchestral instruments. Britain’s Royal Mint issues platinum Britannias, extending its flagship design into the platinum category, while the Isle of Man produces platinum Nobles in fractional weights, including the unusual 1/3 oz platinum coin size rarely offered by other mints.
China has issued platinum versions of its popular Panda series on a sporadic basis. These coins appear irregularly in Western markets and are often difficult to source consistently. When available, platinum Pandas frequently command collector premiums driven by limited mintages and strong demand in Asian markets.
Compared to American Platinum Eagles and Canadian Maple Leafs, these international platinum coins offer greater design variety but generally trade with wider bid-ask spreads and lower dealer inventory levels, which can affect both purchase availability and resale liquidity.
Fractional Platinum Coin Investment
Fractional platinum coins provide entry points to platinum investing without full-ounce capital requirements, though premium trade-offs require consideration.
Advantages of Fractional Sizes
Fractional platinum coins allow investors to access the platinum market at lower capital thresholds. A 1/10 oz platinum coin requires roughly one-tenth the investment of a full ounce, making platinum accessible to smaller budgets. This sizing flexibility enables partial liquidation: selling one-quarter ounce from a position rather than a full ounce provides better control over realized gains and portfolio adjustments.
Fractional pieces suit dollar-cost averaging strategies where investors build platinum positions through regular smaller purchases rather than lump-sum commitments. The 1/10 oz size particularly accommodates this approach.
Smaller denominations also work better for gifts or intergenerational transfers where full-ounce pieces exceed intended value.
Premium Considerations
Fractional platinum carries substantially higher per-ounce premiums than full-ounce coins. Manufacturing costs remain relatively fixed regardless of coin size, meaning minting expenses consume a larger percentage of a 1/10 oz coin’s metal value. Dealers also maintain wider bid-ask spreads on fractional pieces due to lower trading volumes.
Investors must balance fractional convenience against these premium costs. Building positions entirely through fractional purchases increases total acquisition costs significantly compared to accumulating full-ounce pieces when capital permits.
Platinum Coin Values and Pricing
Platinum coin prices reflect spot metal value plus premiums determined by minting costs, market conditions, and collectible factors.
Market Price Determinants
Spot platinum price establishes the baseline value for all platinum coins, fluctuating during trading hours based on global supply, demand, and economic conditions. Premiums over spot cover minting expenses, distribution costs, and dealer margins. These premiums vary by coin type, size, and market conditions: American Eagles typically command different premiums than a Canadian Maple Leaf platinum coin despite identical platinum content.
Condition also affects value significantly. A Brilliant Uncirculated platinum coin for sale trades at standard premiums, while circulated or damaged pieces may sell at discounts to typical bullion pricing. Proof coins and key-date pieces from years with production suspensions carry numismatic premiums well above platinum melt value, appealing to collectors rather than pure bullion buyers.
Current Market Dynamics
Limited platinum coin production creates supply constraints that affect availability and premiums. Dealer inventory fluctuates more dramatically than gold or silver, with some sizes experiencing periodic shortages. Buyback spreads, i.e. the difference between dealer purchase and sale prices, run wider for platinum than gold due to smaller market size.
Authentication also matters critically in platinum markets. Counterfeit platinum coins exist, and proper verification ensures genuine pieces command appropriate values when selling.
Investing in Platinum Coins
Platinum coins require strategic planning around allocation, authentication, and understanding platinum’s distinct investment characteristics.
Building a Platinum Position
Platinum typically represents a smaller allocation within precious metal portfolios compared to gold or silver, often ranging from 5-15% of total precious metals holdings. This reflects platinum’s higher volatility and smaller market size. Investors can enter through lump-sum purchases when prices appear favorable or accumulate positions gradually through dollar-cost averaging, which smooths entry points across platinum’s price cycles.
Working with established precious metals dealers ensures access to genuine coins at competitive premiums. American Eagle platinum coin value reflects spot platinum prices plus premiums for government backing and dealer margins, with established dealers offering transparent pricing on both purchases and buybacks. Dealers like Blanchard maintain authentication standards and provide liquidity for eventual sales.
Platinum vs. Other Precious Metals
Platinum’s industrial demand component creates stronger economic sensitivity than gold’s monetary role. Automotive production cycles directly affect platinum prices, generating larger price swings than gold experiences. Recent market performance demonstrates this volatility and opportunity, with geopolitical factors and economic uncertainty driving precious metals demand. This volatility requires higher risk tolerance but provides diversification benefits within precious metal portfolios since platinum doesn’t move in lockstep with gold or silver.
Long-term supply constraints from concentrated South African production may support prices, though industrial demand shifts toward alternatives could weaken fundamentals.
Authentication and Quality
Genuine platinum coins meet precise weight specifications: 1 oz pieces should weigh exactly 31.103 grams. Reputable dealers verify weights and purity before sales. Visual inspection confirms proper mint marks, edge reeding, and strike quality matching known authentic examples. Third-party grading through services like PCGS makes sense for proof platinum or key-date pieces where condition premiums justify certification costs.
Conclusion
Platinum coins are among the rarest government-issued precious metal bullion, with annual production measured in thousands rather than millions of pieces. American Platinum Eagles and Canadian Platinum Maple Leafs dominate the market, offering .9995 fine platinum in fractional sizes from 1/10 oz to 1 oz that accommodate different investment budgets. These coins combine precious metal diversification with exposure to industrial demand drivers distinct from gold’s monetary role. Platinum’s extreme scarcity and volatility suit investors seeking alternatives to traditional gold and silver holdings. Explore Blanchard’s selection of platinum bullion to add this rare precious metal to your investment portfolio.
FAQs
1. What is a platinum coin?
A platinum coin is a bullion piece containing .9995 fine platinum, typically struck by national mints like the U.S. Mint or Royal Canadian Mint.
2. How much is a platinum coin worth?
Platinum coins are valued at spot platinum prices plus premiums covering minting costs and dealer margins. Proof versions, key dates, and coins from production suspension years may command additional numismatic premiums.
3. How much does a platinum coin weigh?
Platinum coins are available in fractional sizes ranging from one-tenth troy ounce to full one troy ounce, with each size weighing exactly its stated platinum content plus minimal alloy.
4. What are the best platinum coins to buy?
American Platinum Eagles and Canadian Platinum Maple Leafs offer the best liquidity and recognition among platinum bullion. These government-issued coins maintain consistent availability and dealer acceptance for both purchases and eventual resales.
5. Are platinum coins a good investment?
Platinum coins provide precious metal diversification with exposure to industrial demand, though higher volatility compared to gold requires greater risk tolerance. Platinum’s extreme rarity and concentrated supply create both opportunity and risk for investors.
Gold, Silver Climb, Inflation Data Cools Fed Rate Hike Ideas
Posted on — Leave a comment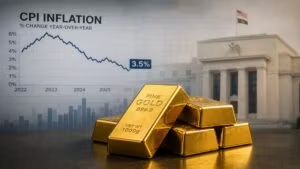 Gold and silver surged higher following news that consumer inflation eased in June. The drop in consumer inflation splashed cold water on ideas of a Federal Reserve interest rate hike in July, which is a positive factor for precious metals.
Steady to lower interest rates tend to be supportive to precious metals, which don’t pay interest. On the flip side, rising rates historically are a headwind for non-interest bearing metals.
So, the news that the June consumer price index (CPI) came in better-than-expected at 3.5% following May’s 4.2% reading took pressure off the Fed to hike rates to try to tamp down inflation. That was ultimately positive for gold and silver.
June CPI Is an Energy Story, As War Tensions Eased
The June de-escalation of the U.S.-Israel war with Iran brought down energy prices last month. That delivered some relief for Americans on a major stress on the cost of living: the price of gas.
The drop in energy prices last month was a key driver tugging consumer inflation lower. Digging into the details of the report, energy prices fell 5.7% overall amid a 9.7% decline in gasoline.
However, analysts warn that July CPI could be another story. Oil prices jumped higher again this month following the collapse of the cease-fire agreement. U.S.-Iran war tensions have heated up again over who has control of the Strait of Hormuz. Limited oil tanker traffic is moving through the waterway, creating a new crunch on energy supplies, which is pressuring oil prices higher.
Inflation Is Still Showing Up In Other Areas for Americans
Looking beyond energy, there are still other forces at play pushing everyday consumer goods items higher. Food prices rose 0.2% in June, with an equal increase of both food at home and food away from home. Notably, drought in U.S. grazing lands has been raising the cost of beef. Last month, beef and veal prices rose 1.2%, with a big 11.8% jump annually.
Inside the labor market, shortages of workers has fueled price increases for home healthcare services, nursing care services, and daycare services.
What this Means for the Fed
The latest inflation report removes immediate pressure on the central bank to pull the trigger on higher interest rates in July. The new Fed Chairman Kevin Warsh has previously made it known that his preference is to wait to hike interest rates to see if inflation will come down on its own.
However, one months of better-than-expected inflation data doesn’t mean the Fed’s job is over. Inflation still remains well above the central bank’s 2% target. While the inflation in recent months was boosted by the U.S.-Iran war, there are other factors at play including, the big jump in investment in artificial-intelligence infrastructure which could continue to push consumer prices higher even if a peace deal is negotiated.
The Outlook for Gold
Gold is consolidating in a stable range around the $4,000 level. After hitting a new all-time high earlier in 2026, bullion has pulled back and recently traded in a sideways range, which is typical after a powerful run-up.
In fact, gold returned double-digit gains the past three years in a row. Gold posted big price run-ups seen in 2023, 2024 and 2025, up 12.8%, 26.3% and 66.5%, respectively.
The long-term trend for gold points higher and the precious metal is at the end of its typical seasonal summer doldrums phase. Looking ahead, the summer pattern typically ends in July, paving the way for a strong fall and winter rally that historically peaks in February.
Looking ahead, Wall Street remains positive on the outlook for gold. Goldman Sachs forecasts gold to climb to $4,900 per ounce by the end of 2026. Morgan Stanley targets gold at $5,200 in the second half of 2026. UBS targets $5,200 over the next 12 months.
The Coin That Captured California’s Golden Dream
Posted on — Leave a commentWhen Gold Changed Everything
In January 1848, a carpenter named James Marshall was inspecting a sawmill under construction along the American River near Coloma, California, when he noticed something glimmering in the water.
At first, it appeared to be nothing more than a few small flakes of metal. But as word spread and the discovery was confirmed, those tiny specks would ignite one of the greatest migrations in American history.
The California Gold Rush transformed a remote frontier into the center of a global movement. Within a matter of years, hundreds of thousands of prospectors, merchants, entrepreneurs, and dreamers poured into California seeking fortune. Some arrived by wagon across the Great Plains. Others sailed around Cape Horn. Many crossed the Isthmus of Panama in hopes of reaching the gold fields faster.
Most would never strike it rich. But the promise of gold changed everything.
The population exploded. New towns appeared almost overnight. San Francisco grew from a small settlement into a booming city. Businesses flourished. Railroads expanded. California’s rapid growth ultimately helped secure its admission to the Union in 1850.
The discovery of gold did more than enrich a handful of lucky miners. It helped reshape the American West.
Seventy-Five Years Later
By 1925, California was preparing to celebrate the 75th anniversary of its statehood.
The state had changed dramatically since the days of canvas tents and muddy mining camps. Railroads connected major cities. Agriculture and industry were flourishing. Hollywood was emerging as a cultural force. Yet Californians remained proud of the event that had launched the state’s remarkable rise.
To mark the occasion, Congress authorized a commemorative half dollar honoring California’s Diamond Jubilee, celebrating seventy-five years since statehood. The coin would serve both as a souvenir and as a tribute to the pioneers whose pursuit of gold helped shape the state’s identity.
A Prospector Frozen in Time
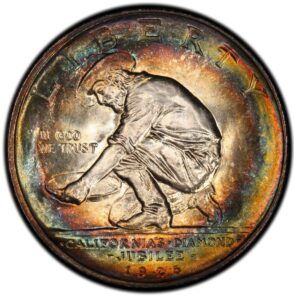
The task of designing the coin fell to sculptor Joseph Mora, often known simply as Jo Mora.
Rather than depict a governor, politician, or famous battlefield, Mora chose a more fitting symbol of California’s origins: the Forty-Niner.
The obverse features a kneeling prospector carefully panning for gold. His sleeves are rolled up. His attention is fixed on the pan before him. The image captures a moment repeated thousands of times during the Gold Rush as hopeful miners searched rivers and streams for signs of wealth.
The design honors the ordinary men and women whose determination helped build the American West.
The Bear That Became a Symbol
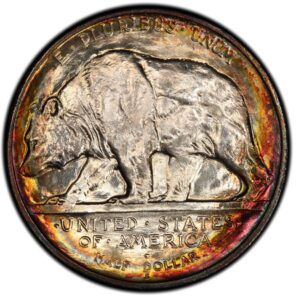
If the prospector tells the story of California’s beginnings, the reverse tells the story of its identity.
A massive grizzly bear strides confidently across the coin’s reverse. The animal had long served as a symbol of California and appeared on the state’s famous Bear Flag. Though grizzly bears had largely disappeared from California by the early twentieth century, they remained a powerful emblem of strength, independence, and frontier spirit.
Collectors have long admired the simplicity of the design.
A Celebration for the Entire State
Festivals, pageants, and public celebrations were held throughout the state to commemorate California’s Diamond Jubilee, or it’s seventy-fifth anniversary. The commemorative half dollar became a centerpiece of these festivities, giving citizens an opportunity to own a small piece of the celebration. Coins were sold for one dollar each, double their face value, with proceeds helping support the anniversary events.
The coin was struck at the San Francisco Mint, a fitting location given the city’s deep ties to the Gold Rush era. Although 300,000 pieces were authorized, only 150,000 were struck, and tens of thousands of unsold examples were eventually melted.
What survives today represents only a fraction of what was originally envisioned.
A Design Critics Nearly Killed
One of the most surprising chapters in the coin’s story occurred before it was ever struck.
Not everyone admired Jo Mora’s design. Some members of the art establishment criticized the proposed artwork and argued that a different artist should be selected. The design was even described as amateurish by one prominent reviewer. Fortunately, the committee overseeing the project stood behind Mora’s vision and moved forward with the original concept.
Today, the California Diamond Jubilee Half Dollar is frequently cited as one of the most attractive classic commemorative issues. Many collectors consider its straightforward depiction of California history to be among the strongest designs of the era.
The Enduring Appeal of the Forty-Niner
The California Gold Rush lasted only a few years, but its impact continues to shape the American imagination. Stories of prospectors crossing deserts, climbing mountains, and risking everything for a chance at discovery remain deeply woven into the nation’s history. The Gold Rush represented optimism, opportunity, and the belief that fortunes could be changed through determination and hard work.
The California Diamond Jubilee Half Dollar captures that spirit.
Its prospector reminds us of the dream that drew thousands westward. Its grizzly bear reflects the rugged independence that came to define California. Together, they tell the story of a state transformed by gold and of a nation expanding toward the Pacific.
A century after its release, the California Diamond Jubilee Half Dollar remains more than a commemorative coin. It is a tribute to one of the greatest adventures in American history.
What’s Next for Gold? 4 Factors That Could Trigger a Breakout
Posted on — Leave a comment
As we move into the second half of the year, you may be heading out on vacation, spending hot summer weekends at the pool, or grilling in your backyard. In the midst of the hot summer haze, gold is consolidating quietly around the $4,000 level after a several-month-long consolidation phase. If you follow precious metals, you may be wondering what’s next?
Wall Street experts agree. Gold’s recent action looks more like a consolidation than a change in trend. After hitting a new all-time high earlier in 2026, bullion has pulled back and traded in a sideways range, which is typical after a powerful run-up.
Bottom line? The long-term uptrend for gold remains intact. It’s only a matter of time before bullion takes off again to the upside.
For investors, the bigger question is not whether gold has lost its shine, but what could light the next fire under it. The answer is that there are several scenarios that could trigger an upside breakout in gold. And, when breakouts happen—they typically happen fast. Here’s a look at four scenarios that could drive gold sharply higher in the second half of the year.
Weaker-than-expected U.S. economic activity
Watch the labor market, consumer spending, housing, and credit conditions. These are the places a slowdown often shows up first before it spreads to the rest of the economy. If weakness starts to broaden across labor, consumers, and credit, investors often begin to price in slower growth and lower interest rates, which supports gold. If the economy worsens, recession fears rise, and demand for gold will soar.
A fresh or extended geopolitical shock hits markets
These could include an escalating or prolonged resumption of the U.S.-Iran war and ongoing disruptions to global oil supplies. Another potential geopolitical shock could be new U.S. tariffs following our nation’s decision not to continue the United States-Mexico-Canada Agreement (USMCA). Or export restrictions on key critical minerals. The price of gold responded strongly to heightened geopolitical concerns in recent years, and global stress heightens investor demand to own the safety of bullion.
A shift to lower Federal Reserve interest rate expectations
Ideas about where monetary policy is going have ping-ponged back and forth over the past year. The new Fed Chairman Kevin Warsh has committed to price stability, but also has signaled a willingness to wait and see if inflation will come down. If it becomes clear the Fed won’t hike interest rates in 2026 and could lower rates later this year or in early 2027, that could light a fire under gold to the upside.
Gold historically trends higher throughout Fed easing cycles because the opportunity cost of holding a non-yielding asset falls. This is key dynamic to watch because it can quickly change investor behavior across the whole market. Even a modest move toward easier policy will make gold look more attractive relative to cash and bonds.
A sharp correction in the U.S. stock market
If the stock market topples from its overvalued conditions into a correction or bear market, gold will climb. Gold soars during stock market sell-offs, because bullion is a safe-haven asset that is non-correlated to equities and helps investors preserve and protect their capital. Physical gold is a proven store of value as paper assets like stocks depreciate.
Big Picture
Big picture, beyond short-term triggers, gold continues to benefit from structural support such as central bank buying and diversification away from dollar-based assets. Those forces do not create overnight fireworks, but they are providing a base that will allow a new gold breakout to stick once upside momentum kicks back into action.
Gold also has a tendency to attract buyers after pullbacks. Especially when long-term investors see value and momentum traders wait for confirmation. A renewed round of buying triggered by any of these factors could quickly spiral into another massive leg higher in gold.
If you’ve been considering adding gold to your portfolio or increasing your allocation to physical metals, now is an extremely opportune time while prices are lower than their recent peak. Contact Blanchard today to explore current opportunities before the next upside breakout in gold begins.
Gold and Silver Surge Higher After U.S. Jobs Growth Hit the Skids in June
Posted on — Leave a commentGold and silver popped higher following news that the U.S. economy added far fewer new jobs than expected in June.  The disappointing news revealed that only 57,000 new jobs were created last month, versus the 113,000 economists had expected to see at the mid-point of the year.
Job growth in April and May was also revised down a total of 74,000, the Department of Labor said.
Gold gained more than 2%, climbing above $4,065, while silver traded above $60 an ounce. The stock market fell on the news.
The June jobs report was a stark reversal from recent months which saw fairly strong numbers, especially as April and May were revised lower.
The jobs report took center stage for financial markets as the recent narrative has focused around inflation—which remains high and above the Federal Reserve’s 2% target. If the jobs market continues to slow down, it lowers the chances the central bank will raise interest rates anytime soon.
Digging deeper into the June jobs report, the number of hours worked last month declined, indicating an upcoming slowdown in broader economic activity.
Key takeaway?
What is means for the Fed: The cooler jobs growth and the recent decline in energy prices takes pressure off the Federal Reserve to hike interest rates in the next several months, which is a positive for gold. Wall Street largely expects the Fed to hold interest rates steady at its July meeting.
Precious metals also gained steam from Federal Reserve Chairman Kevin Warsh’s remarks this week that dampened ideas the Fed could hike interest rates in 2026 to combat rising inflation. Gold has been tracking expectations for Fed monetary policy for months.
Fed Chairman Warsh said “inflation risks have come down” at a European Central Bank conference in Portugal. Historically higher borrowing costs are a challenge for non-interest paying precious metals—so Warsh’s comments were seen as supportive to gold.
The historic run in gold took a breather in recent months, but if you look at a 10-year chart you can see the long-term uptrend remains intact. Gold has been testing a key support zone in the $4,000 area and recent action shows eager buyers at this level.
Many on Wall Street and around the globe believe this recent pause in the gold rally was simply a breather, not an end to the long-term uptrend. In a recent research report, European asset management firm Incrementum AG wrote “The future of money lies in its past. ” The firm described gold as an increasingly important monetary anchor as the post-1971 global fiat currency system reveals “unmistakable signs of fatigue.”
“The Pax Americana — that political, military, economic, and above all monetary order that has shaped the global system since 1945 — is drawing to a close,” the report said.
Gold is serving as a neutral reserve asset in the rapidly changing global order. What’s more, the historic role of government bonds as a “risk-free asset” is quickly dissolving as inflation-adjusted returns sink to deeply negative levels. This is creating an environment where investors are seeking alternative stores of value, and are shifting out of U.S. Treasuries into gold.
The firm pegged a target of $8,900 for gold by the end of the decade, or less than four years from now.
British Sovereign Gold Coin: Mint Marks and Monarchs Through 200 Years of History
Posted on — Leave a commentThe British Sovereign gold coin struck in 2025 carries the exact weight, purity, and gold content of one minted in 1817, an almost unmatched continuity in global coinage. This 22-carat gold classic has moved through multiple monarchs, two world wars, and the full arc of the British Empire, all while maintaining its specifications with remarkable precision. Yet this uniformity disguises a surprisingly complex series. Differences in mint marks, monarch portraits, and production periods mean that coins which appear identical at first glance can vary dramatically in rarity and value. This guide outlines how to identify Sovereigns across eras, the role of worldwide mint locations, and what separates standard bullion pieces from the numismatic coins that command meaningful premiums.
What Is a British Sovereign Gold Coin?
The British Sovereign represents one of history’s most enduring gold coins, combining consistent specifications with evolving designs that reflect two centuries of British monarchy.
Historical Context
The modern British Sovereign emerged in 1817 during Britain’s Great Recoinage, a comprehensive reform of the nation’s currency system following the Napoleonic Wars. The name itself references earlier English gold sovereigns minted from the late 15th through the 17th centuries, connecting the new coin to centuries of British monetary tradition. Created as legal tender with a face value of one pound sterling, the Sovereign became a cornerstone of the British Empire’s monetary system, circulating throughout territories from London to the furthest colonial outposts.
Specifications That Never Changed
The physical characteristics of the British gold Sovereign coin were established in 1817 and have remained constant for more than 200 years. Each coin weighs exactly 7.98 grams with a diameter of 22.05mm. The gold content is 7.32 grams of pure gold – equivalent to 0.2354 troy ounces – achieved through 22-carat purity (91.67% gold alloyed with copper). This copper addition provides durability for circulation while maintaining substantial gold content.
These specifications remained fixed for practical reasons: consistency enabled international trade, as merchants and banks worldwide could rely on the Sovereign’s exact gold content without testing individual coins. The standardization also facilitated the coin’s role in the gold standard system that dominated international finance through the 19th and early 20th centuries. A Sovereign from 1820 could circulate alongside one from 1920 with identical intrinsic British Sovereign gold coin value, creating remarkable continuity across a century of political, technological, and social transformation.
Watch this video for an accessible introduction to the British Sovereign gold coin.
The Iconic Design: St. George and the Dragon
The Sovereign’s enduring visual identity stems from designs that balance consistency with monarchical evolution.
Benedetto Pistrucci’s Masterpiece

Image: Benedetto Pistrucci, the Italian engraver who designed the iconic St. George and the Dragon reverse.
Source: The Royal Mint
An Italian engraver working at the Royal Mint created what would become Britain’s most recognizable coin image. Benedetto Pistrucci’s 1817 design depicts St. George mounted on horseback, slaying a dragon with a sword, a scene symbolizing the triumph of good over evil and, by extension, British strength and virtue. The composition’s classical style and fine detail established an artistic standard that has defined the British gold Sovereign coin for two centuries.
While Pistrucci’s St. George reverse became the default design, not all Sovereigns feature it. Victorian issues from 1838 to 1887 used a shield reverse displaying the royal arms, and occasional commemorative or special releases have featured alternative heraldic designs. These variations create distinct collecting categories within the broader Sovereign series.
Obverse Portraits Across Monarchs
The obverse carries the reigning monarch’s portrait, evolving with each succession and sometimes within a single reign. Long-reigning monarchs like Victoria and Elizabeth II appeared in multiple portrait styles – young head, jubilee, and veiled/old head versions reflecting their aging and different artistic approaches across decades. Each portrait change from George III through Charles III captures period-specific artistic conventions, creating visual markers that help collectors instantly identify a coin’s era even before checking the date.
The Monarchs of the Modern British Gold Sovereign Coin
Since 1817, nine British monarchs have appeared on Sovereigns, each reign creating distinct collecting opportunities based on production span, mintage levels, and historical circumstances.
George III (1817-1820)
George III Sovereigns represent the series’ inaugural issues, struck during the final years of his reign. Their status as first modern Sovereigns gives them inherent collector appeal, though the short production window and two-century age create natural scarcity that commands premiums over later common dates.
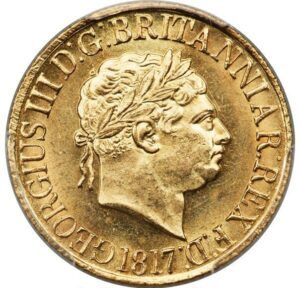
Image: 1817 George III Sovereign showing the first modern Sovereign design.
Source: Heritage Auctions
George IV (1820-1830)
George IV appears in two portrait styles: bare head and laureate (crowned with laurel) head variations. Production remained relatively consistent through the decade, making these coins moderately available today, though still significantly scarcer than Victorian issues.
William IV (1830-1837)
William IV’s brief seven-year reign produced the scarcest mainstream British Sovereign gold coin monarch. Limited production years mean these coins command substantial premiums regardless of condition, with even worn examples valued well above gold content due to genuine rarity.
Victoria (1837-1901)
Victoria’s 64-year reign dominates vintage Sovereign availability. Three distinct portrait types – Young Head (1838-1887), Jubilee Head (1887-1893), and Old or Veiled Head (1893-1901) – reflect her aging across the era. The Young Head period used a shield reverse rather than St. George, creating a major design distinction. High production volumes, particularly in later decades, make Victorian Sovereigns the most accessible vintage issues for collectors today.
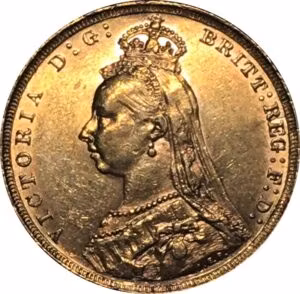
Image: Victorian Sovereign showing Queen Victoria’s Veiled Head or Old Head portrait design.
Source: Numista
Edward VII (1901-1910)
Edward VII’s nine-year reign created moderate scarcity – shorter than Victoria but longer than William IV. Consistent design throughout the period simplified production, though colonial mint output during this era holds particular significance for collectors focused on branch mint issues.
George V (1910-1936)
World War I dramatically impacted George V British Sovereign gold coin production. Pre-war mintages were substantial, but wartime demands reduced output significantly. The 1925 and later dates show particular scarcity as Britain moved away from gold circulation, making post-1920s issues notably harder to find.
George VI (1936-1952)
George VI Sovereigns are exceptionally rare. Only proof specimens were struck in 1937, followed by complete wartime cessation. Limited post-war resumption means any George VI Sovereign represents a significant numismatic prize, with circulation strikes virtually nonexistent.
Elizabeth II (1952-2022)
Elizabeth II’s 70-year reign saw British Sovereign gold coin production resume as bullion rather than circulating currency. Brief output in 1957-1959 preceded regular annual production from 1974 forward. Five different portrait designs across her reign reflect evolving artistic styles. Modern production volumes make these the most common Sovereigns available, serving both bullion investors and collectors.
Charles III (2022-Present)
Charles III Sovereigns debuted in 2022 with strong collector interest in first-year issues. The design maintains St. George and the Dragon on the reverse while introducing the new monarch’s portrait, continuing two centuries of Sovereign tradition into a new reign.
Understanding Mint Marks: Where Was Your Sovereign Made?
A tiny letter on the reverse can multiply British Sovereign gold coin value several times over, as mint marks identify which facility across the British Empire struck the coin.
London Mint: The Unmarked Standard
Sovereigns without mint marks originated at the Royal Mint in London, the default production facility. London historically produced the highest volumes, making unmarked Sovereigns generally the most available for any given date. While London coins don’t carry scarcity premiums based purely on origin, they remain the baseline against which branch mint issues are compared.
Branch Mint Production Across the Empire
Britain established colonial mints to convert locally mined gold into coinage, reducing shipping costs and supporting regional economies.
Sydney (S)
Australia’s first mint struck British Sovereign gold coin pieces from 1855 through 1926, spanning the gold rush era and beyond. High production volumes make Sydney Sovereigns relatively available, though strong collector demand from the Australian market supports premiums over London issues.
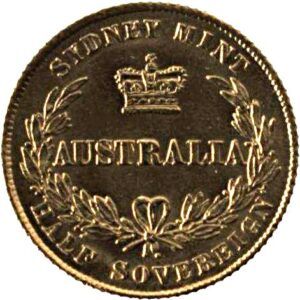
Image: Victorian era Australian Sovereign showing the distinctive shield reverse design used before St. George.
Source: Numista
Melbourne (M)
Operating from 1872 to 1931, Melbourne produced substantial quantities with notable year-to-year variation. Certain dates command significant premiums due to lower mintages, making Melbourne mint marks worth careful examination.
Perth (P)
Perth’s 1899-1931 production span makes it the latest-starting Australian mint. Generally lower volumes than Sydney or Melbourne create inherent scarcity, with Australian collectors particularly focused on completing Perth date runs.
Bombay (I)
India’s mint produced Sovereigns in 1918 only, making any Bombay-marked coin extremely rare. These command premium multiples reaching five to ten times comparable London examples.
Ottawa (C)
Canadian production from 1908 to 1919 created limited-year scarcity that appeals to both British and Canadian collectors, with premiums reflecting genuine rarity rather than speculative demand.
Pretoria (SA)
South Africa’s Pretoria Mint struck Sovereigns from 1923 to 1932. Most issues carry the “SA” mint mark, though a few early pieces can be identified by subtle design features rather than a visible mark. Production volumes were moderate, giving collectors accessible branch-mint options without extreme premiums.
Key Dates and Rare Sovereigns
Specific years and mint combinations create significant value premiums based on mintage levels and historical circumstances, with British Sovereign gold coin price varying dramatically depending on date and mint mark.
Victorian Era Rarities
Several Victorian Sovereigns stand out for exceptionally low mintages or unique production circumstances. The 1841 London issue remains one of the rarest circulation Sovereigns ever struck, while the 1863 London coin without a die number represents another major rarity due to its extremely limited surviving population. The 1879 Sydney Sovereign is the great Australian key date of the era, produced in very small quantities and highly prized by collectors.
Edwardian Through George VI Keys
Moving into the early 20th century, Edward VII’s 1902 Matte Proof is a special striking with a distinctive satin finish. George V wartime issues – particularly the 1917 London Sovereign – show sharply reduced mintages, while 1920 London continues the trend of post-war scarcity. The one-year 1918 Bombay issue and select low-mintage Ottawa dates command strong premiums. For George VI, only the 1937 Proof was struck; no circulation issues exist, making any genuine specimen a significant numismatic piece.
Modern Rarities
Elizabeth II’s era includes certain low-mintage dates and special proof issues, especially from the 1980s and 1990s, though none approach the scarcity of pre-1953 key dates.
British Half Sovereign Gold Coin: The Smaller Alternative
Half Sovereigns offer an accessible entry point into British gold coinage while maintaining the full Sovereign’s design integrity and historical continuity.
Specifications and Design
Weighing 3.99 grams, i.e. precisely half the full Sovereign, and measuring 19.30mm in diameter, the British Half Sovereign gold coin maintains the same 22-carat purity and proportional gold content. Designs mirror their full-sized counterparts: the St. George and the Dragon reverse (with the same exceptions, such as Victorian shield issues) and the corresponding monarch portraits across the same reigns.
Production and Collecting Appeal
Half Sovereigns were struck in parallel with full Sovereigns, following the same portrait changes and mint mark variations. Production volumes were often significantly lower, creating inherent scarcity that is sometimes overlooked by collectors. This relative neglect can create opportunities: Half Sovereigns frequently trade closer to bullion value despite comparable (or occasionally greater) rarity, making set-building or era-focused collecting far more achievable on modest budgets.
British Sovereign Gold Coin Collecting Strategies
Collectors approach Sovereigns through multiple pathways depending on budget, interest, and goals.
By Monarch
Assembling one British Sovereign gold coin from each reign creates a focused collection that spans more than two centuries of British history. This approach offers a clear structure: Victoria and Elizabeth II provide abundant affordable options, while earlier monarchs such as William IV and later figures like George VI present significant challenges due to scarcity and corresponding premiums. Collecting by reign delivers historical breadth without the cost or complexity of pursuing complete date runs.
By Mint
Pursuing all mint marks creates a geographically diverse collection reflecting the British Empire’s extent. Alternatively, focusing exclusively on branch mints or limiting to London production narrows scope while maintaining coherent themes.
By Date Run
Complete date runs require commitment and capital. Victorian sets span decades but remain feasible given high production volumes. Edward VII’s short reign makes complete runs achievable for dedicated collectors. Modern Elizabeth II collections from 1974 forward offer completable goals without confronting 19th-century scarcities.
Type Collecting
Focusing on major design types, such as Victoria’s three portrait styles, shield versus St. George reverses, or significant portrait changes across monarchs, creates visually distinct collections without exhaustive date pursuit.
Investment Grade
Concentrating on common dates in exceptional grades combines bullion value with numismatic appreciation potential, with the current price of British gold Sovereign coins in high grades offering accessible entry points for quality-focused collectors. Modern proof sets offer pristine examples with presentation packaging, appealing to collectors seeking quality over historical depth. Sovereigns fit within a broader precious metals investment strategy that can include both bullion and numismatic pieces across different asset categories.
Conclusion
The British Sovereign’s two-century consistency in weight, purity, and gold content creates a collecting landscape where specifications remain unchanged, yet historical context, monarch portraits, and mint locations generate remarkable variety. From George III’s inaugural 1817 issues to the modern strikes of Charles III, Sovereigns blend intrinsic gold value with deep numismatic significance across multiple reigns and seven historic mints. The value of British sovereign gold coin pieces depends on both precious metal content and numismatic premiums from scarcity and historical importance. Explore Blanchard’s Royal Mint gold selection to add coins to your portfolio where centuries of history combine with enduring gold value.
FAQs
1. How much is a British Sovereign gold coin worth?
Common-date Sovereigns trade close to their gold content value, while scarce dates, rare mint marks, and key monarchs command substantial premiums above British Sovereign gold coin melt value. Value depends on the specific year, mint location, monarch, and condition.
2. What is the weight of British gold sovereign coin pieces?
British Sovereign gold coin weight is 7.98 grams total, containing 7.32 grams of pure gold at 22-carat purity. These specifications have remained unchanged since 1817.
3. What is the difference between a Full Sovereign and Half Sovereign?
A Half Sovereign contains exactly half the gold content and weight of a full Sovereign while maintaining the same 22-carat purity and proportional design. Half Sovereigns offer a lower-cost entry point with similar historical significance.
Could Private Credit Defaults Trigger a 2008-Like Crisis?
Posted on — Leave a commentAre you looking for a movie to watch this weekend? Consider the 2015 movie The Big Short, starring Brad Pitt, Steve Carell, Christian Bale, and Ryan Gosling, which outlines the triggers of the 2008 Global Financial Crisis, along with dark comedy and celebrity cameos. Why is this worth watching? Today, risks bubbling up in the private credit market are triggering concerns that another financial crisis could be brewing behind the scenes.
2008 financial crisis impact: Risks bubbling up in the private credit market are triggering concerns that another financial crisis could be brewing behind the scenes.
2008 financial crisis impact
By the numbers, the economic impact of the 2008 financial crisis was staggering. The stock market plunged 50%, 8.8 million Americans lost their jobs, home values fell by 30%, and over 16 million homes went into foreclosure.
Gold then and now
Looking back, gold pulled back as the 2008 financial crisis started. Why? Hedge funds, banks, and institutional investors faced margin calls and sold gold to raise cash. Gold provided liquidity in a crisis—one of the key attributes of a safe-haven asset—but then the precious metal rocketed higher. After touching $700 an ounce in October, gold soared in a multi-year bull market to a record high above $1,900 an ounce in 2011.
Today, gold is in a consolidation phase, faced with the headwinds of higher Federal Reserve interest rates to combat inflation. Gold had been priced in expectations of Fed rate cuts this year, so now we are seeing a “repricing” of interest rate expectations with a slightly lower price in gold.
The private credit story
Now getting back to private credit…Behind the scenes in recent years, private credit issuance has exploded. What is private credit?
It’s a form of lending provided by private equity firms to companies. These are loans that are not traded on the public markets. All sorts of borrowers, from insurance companies to health care firms to software technology companies, have borrowed over $40 trillion from private credit lenders. The U.S. life insurance industry has become extremely exposed, with 20% of the industry’s holdings held in the most illiquid kind of fixed-income investments, according to a new study by Moody’s Corp.
The risks?
Private credit loans are unregulated. There is no secondary market to trade this debt. As these loans have exploded in size and across industries in recent years, concerns about defaults and losses are piling up, especially if AI disruption creates more volatility in the stock market.
Just this week, alternative asset manager Apollo Global Management limited withdrawal requests from its largest non-traded private credit fund after investors asked to redeem 17% of the fund’s assets.
The bottom line
While much of this may sound arcane and complicated, just as it was in the 2008 financial crisis, stretched equity valuations leave us all vulnerable. Runs on private credit funds could freeze up credit, and spillover contagion could flow into traditional lending, stock, and bond markets. At the same time, the Federal Reserve faces less policy flexibility today than in 2008, given high inflation and the massive government debt burdens.
Time to make the popcorn
As one hedge fund manager said in the movie The Big Short: “Our investment strategy was simple. People hate to think about bad things happening, so they always underestimate their likelihood.” Many Americans today are unaware of the stress growing in the private credit sector. Others may underestimate what could happen.
When it happens (and history shows there’s always another financial crisis ahead), gold can protect and grow your wealth, just as it did for investors in 2008 when it climbed from $700 to over $1,900 an ounce. Check out the movie. And, consider how increasing your allocation to gold today at favorable pricing levels could protect and grow your wealth when the next financial crisis rolls around. Pass the popcorn.
Survey: 89% See Global Central Bank Gold Reserves Climbing Over Next Year
Posted on — Leave a commentCentral banks bought an average of 1,000 tons of gold over the past four years, up significantly from the 500t average over the last decade. This marked a big jump in physical gold buying as geopolitical and economic uncertainty soared around the globe.
Central bankers aren’t done buying gold, not by a long shot. Over the next 12 months, 89% of global central bankers expect official gold reserves to climb, according to a new survey of central bankers conducted by the World Gold Council this spring.
Global central banks could seem like a group of faraway, opaque organizations that no one really knows much about.
This new survey directly asked central bankers themselves for their thoughts on gold, peeling back some of the secrecy that can exist around official reserve decisions.
Here’s why you should take a closer look on what central banks have been quietly doing, behind the scenes in recent years.
Global central banks aren’t trying to day trade precious metals—they are trying to de-risk their portfolio reserves. In recent years, central banks have been buying gold systematically, regardless of price. They’ve moved away from owning U.S. Treasuries and dollar-denominated assets and moved into owning gold, which is not beholden to or controlled by any country or government.
Here’s what the central bankers told the World Gold Council in a survey ending May 19. Notably, most of the central bankers’ responses were received after the start of the U.S. war against Iran.
Forty-five percent of all central banks said their own gold reserves will increase in the next 12 months. Fifty-three percent of emerging markets central banks said their own gold reserves will increase in the next 12 months.
Key reasons central bankers say they own gold:
- Performance in times of crisis: 90%
- Long-term store of value: 84%
- Effective portfolio diversifier: 83%
- Diversification policy: 80%
- Geopolitical risk hedge: 78%
More Gold, Less U.S. Dollar Holdings Ahead
What’s more, the central bankers expect gold accumulation trends to continue. Over the next five years, 84% of the central banks surveyed expect gold reserves to be higher. Meanwhile, 74% of central banks said they see moderately or significantly lower U.S. dollar holdings within global reserves over the next five years.
The U.S. dollar was the main fiat currency with a target on its back. Levels of central banks holdings of the euro and renminbi were expected to be unchanged five years from now.
Central banks buy gold for many of the same reasons that individuals like you want to own physical precious metals. Physical gold and silver are tangible assets that carry no credit or counterparty risk, they remain a trusted and recognized assets around the world when fiat currencies go up and down.
When you own gold, you own it. No one can freeze your asset and devalue your gold. Gold and silver are physical, borderless assets. Physical precious metals exist outside the digital banking system, making them immune to asset freezes or financial sanctions imposed by any nation.
Physical gold and silver carry no default risk. Unlike paper currencies, government bonds, or other securities, physical gold does not depend on an issuing institution’s ability to pay its debts. It holds intrinsic value that cannot be devalued by central bank printing presses.
Precious metals act as liquidity in times of crisis. Gold and silver are highly liquid assets that are universally recognized. In times of financial distress, you can sell precious metals anywhere quickly and privately.
Historical trust. Civilizations have trusted gold as a store of value for thousands of years. Central bank managers today use this legacy to instill confidence in a nation’s economic stability. Individual investors have peace of mind that precious metals have a 5,000-year proven track record of preserving and growth wealth.
On Wall Street, there’s an old saying: “Don’t fight the trend.”
Today, central bankers are trusting and investing in gold and plan to continue to increase gold reserves looking five years into the future. Central bankers are some of the longest timeframe investors on the planet. They don’t buy and sell gold based on short-term events or price movements—they buy gold to preserve and protect their nation’s wealth.
The recent pullback in gold prices created opportunity for long-term individual investors like you. Have you considered locking in some profits in the toppy stock market and rolling that over into precious metals? It’s never an actual profit until you take it. If the stock market is down 50% a year from now, like it was after the Dot.com crash in 2000, you’ll be happy you rolled some of that money into precious metals.


