The Relationship Between the Price of Gold and the 10-Year TIPS Yield and Why it Matters
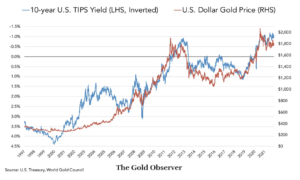
Posted on — 1 CommentFor more than 15 years, there has been a stable, inverse relationship between gold and US bond yields adjusted for inflation. Typically, higher Treasury yields have the effect of bringing gold prices down because gold, which has no yield, is less attractive in comparison.
Between 2006 and 2021, the correlation coefficient between the two has been -0.933 indicating an almost completely opposite relationship.
Today, that’s changing.
The breakdown of this correlation seems strangely fitting in today’s setting of anomalies. Consider, for example, that bonds, which tend to rise as stocks fall, are now rising alongside equities. The combination of higher rates and lasting inflation has disrupted this tendency and today the correlation of returns for the S&P 500 and long-term Treasury bonds is at a two-decade high. North is South. East is West.

The normally reliable correlation between gold prices and the 10-year TIPS yield has deviated as real yields have risen while, at the same time, gold prices have climbed amid increased geopolitical risk brought on by the bloody Hamas-Israel conflict.
Adding to this is the fact that in 2022 central banks bought a record-breaking 1,136 tones of gold, worth roughly $70 billion. As the Financial Times remarked, this staggering amount of purchasing occurred because “countries aimed to reduce their reliance on the dollar after Washington weaponized its currency in sanctions against Russia.”
The change in this historical relationship has prompted some to ask, where do things go from here?
While it’s not clear if the two trend lines will realign, there are several reasons to believe that the price of gold could remain high. One such reason is that the gold market was very short. In other words, many investors held positions that stood to gain if gold prices fell. As the price of gold resisted that expectation, those same investors were forced to cover their positions. As a result, short positions recently dropped by 31,096 contracts to 89,605. In fact, this was the second-biggest ever short-covering rally on record.
Additionally, heightened levels of gold purchasing in China have led to a dramatic premium over international prices. In some cases, this premium was over $100 per ounce. This surging demand stems from falling property values, a major store of value for many Chinese citizens. The declining yuan has likely also contributed to increased gold purchases.
The key takeaway for investors is that the power of gold to serve as a safe haven in periods of instability and uncertainty is strong enough to break a decade-and-a-half trend that would normally see gold declining in price today.
Want to read more? Subscribe to the Blanchard Newsletter and get our tales from the vault, our favorite stories from around the world, and the latest tangible assets news delivered to your inbox weekly.
1 thought on “The Relationship Between the Price of Gold and the 10-Year TIPS Yield and Why it Matters”
Comments are closed.


I was wondering if the strong relationship is due to serial correlation in the economic data. What was the Durban Watson statistic in your study?
Len