


How the Bull Became the Dragon
Posted on — Leave a commentAs children, we hear stories explaining how the zebra got its stripes or how the elephant got its trunk. However, in the future, it might be more fitting to imagine how the bull became the dragon.

China is becoming a dominant force in our increasingly global economy. Gold investors in the U.S. are looking for economic indicators within our borders. However, they should be looking abroad to China. Consumer spending is primed as the ethos of the “new economy” in the country takes hold. This change has significant ramifications for gold purchasers.
In previous years China’s economic growth came from government spending. This “old economy” gave rise to infrastructure development sustained with inexpensive labor. This system didn’t work. Today, the country is modernizing with initiatives designed to empower the people. The result is a thriving consumer class. Throughout the first three-quarters of 2016 consumption alone contributed to 71% of the country’s GDP growth. This surge has left some asking what the consumers are buying.
Luxury goods are becoming a major draw amid consumers. Today, the Chinese represent about one-third of the global sales in this category. Their appetite for name brands like Cartier and Louis Vuitton is so high that they’re traveling abroad for purchases. One Consumer Affairs Correspondent writing for The Times reports, “The average Chinese tourist spends almost £3,000 on a visit to Britain, with the wealthiest spending £50,000.” This annual trend has earned the name “Golden Week,” both a national holiday and shopping spree. Consumers in China are moving away from mass produced products to more premium goods according to market researcher McKinsey.
These luxury purchases, which often contain gold, are influencing commodity prices. In 2016 China was the largest gold consumer for the fourth consecutive year. Moreover, in recent years 57% of gold demand came from jewelry purchases, and 60% of this spending comes from India and China. Compounding these figures is increased expenditures in gold bullion.
These two styles of purchase can move in similar patterns because “82 percent of Chinese agree that ‘gold jewelry is as much an investment as a fashion statement,’” According to the World Gold Council. Interestingly, gold sits at the intersection of modernity and tradition. The younger demographic characterized by increased consumer activity wants to be associated with the look of gold. Meanwhile, the older generation is still rooted in the idea that gold “is culturally accepted as a place to put your money,” according to the chief investment officer at Merk Investments LLC. Amid changing times, gold still proves its enduring value among all groups.
Investors today need to consider how international developments like those in China will influence their holdings. Too often we narrow our focus to U.S. headlines. Instead, we should take a more holistic approach and look beyond just bulls and bears. This wider perspective is of particular importance among commodities like gold that are accepted and valued across all countries. Chinese consumers have cast their vote and gold is a clear winner.
Silver Production Fell In 2016 – First Time in 14 Years
Posted on — Leave a commentRemember back to college economics? Good old supply and demand? Well, the numbers are tilting favorably for silver. Simply put – the silver equation shows more demand than supply and that is bullish for prices ahead.
Global silver mine production fell in 2016, for the first time since 2002, according to the newly released World Silver Survey 2017 (Silver Institute and GFMS Team at Thomson Reuters.).
Here’s the numbers:
2016 Supply 1007.1 million ounces
2016 Demand 1027.8 million ounces
Doing the math, that leaves a silver deficit of -20.7 million ounces and ultimately puts upward pressure on prices.
Where Does The World’s Silver Come From?
On the supply side, Mexico was the largest silver producer in 2016, followed by Peru, China, Chile and Russia, the report said.
Who Uses Silver?
Silver is both an industrial and precious metal. Investors who purchase silver see a dual demand base for this commodity currency.
On the demand side, industrial fabrication made up the largest component in 2016 totaling 561.9 million ounces. Jewelry stands in second place at 207 million ounces and coins and bars are in a close third at 206.8. Silverware comprised 52.1 million ounces of total demand in 2016.
It is well known that physical ownership of silver offers investors many of the same diversification properties as gold, but at a much lower entry cost. Gold trades at about $1,257.00 an ounce right now, while you could purchase an ounce of silver for about $17.00 an ounce.
New applications for silver are exploding in industry and manufacturing, which will keep upward pressure on prices. Demand is growing, while supply is shrinking due to reduced mining.
Here’s one example: in 2016, silver demand for photovoltaic applications skyrocketed by 34 percent rise to reach 76.6 million ounces. This growth was the strongest since 2010 and driven by a 49 percent increase in global solar panel installations, the Silver Institute said.
Learn More
Read about fascinating new applications for silver in this LinkedIn article authored by Blanchard CEO & President David Beahm.
Follow David on LinkedIn for weekly updates on precious metals investing.
Investing Strategies
Investors turn to physical precious metals as an important component of portfolio diversification. Many studies have shown that when stock prices go down, gold and silver prices tend to rise – often significantly. Owning physical gold and silver is appropriate for all investors and can improve your long-term investment prospects. The latest supply/demand figures for silver only underscore the positive long-term price outlook for silver.
Silver prices have already been climbing in 2017. Now is a good time to add physical silver exposure to your portfolio before prices climb even more.
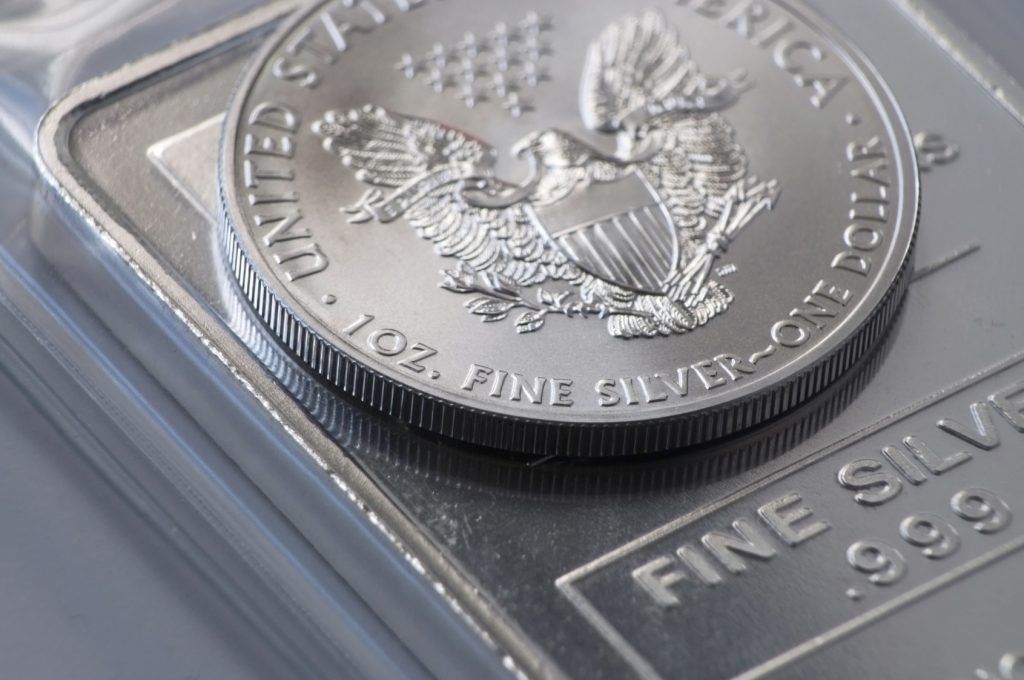
A great option to add to your portfolio are silver bullion coins. The 2017 1 ounce American Silver Eagle can be purchased right now for around $19.37. Market prices change daily, call Blanchard for today’s price at 1-800-880-4653.
Political Risks Rattle Markets
Posted on — Leave a commentFresh new controversy regarding the Trump administration surfaced on Tuesday night of last week, and the market’s reaction was harsh.
By the end of the day on Wednesday, the Nasdaq 100 was down a little over 2.5%, and the S&P 500 and Dow Jones were both off roughly 1.5%. Given that a major market index has not moved more than 1% in a long time, Wednesday’s trading activity was quite serious and definitely put investors on the edges of their seats.
On an intraday basis on Wednesday, there was simply no reprieve for passive stock investors; every uptick was short-lived. The real talk of the town, however, was the explosion in volatility. The VIX index soared over 35% to climb above 15.
The explosion in volatility is highly interesting, because volatility hit a 23-year low two weeks ago. An article published on Blanchard’s investment page noted the interesting correlation between fresh new lows in volatility and imminent stock markets selloffs. Although it’s impossible to predict extemporaneous political events, the events always seem to occur right after volatility reaches an extreme low.
Because there was a surprising amount of complacency among investors, as noted in the article, the market reacted quite violently as investors rushed for the exit when news broke of President Trump’s recent activity. Investors immediately became less optimistic about proposed tax reform and all of Trump’s promised pro-growth policies.
If he were to be removed form office in an total worst-case scenario, it seems logical that much of the recent market run-up, that’s predicated on his aforementioned growth agenda, would unwind. Even if the administration’s scandal is overblown, it might be more difficult to push through new reform with obstinate members of congress who look at Trump’s recent activity with disdain. This was the logic behind Wednesday’s sell-off.
Both democrats and republicans in congress were also unnerved with the fact that Trump apparently asked the former FBI director, James Comey, to stop an investigation into a mutual connection.
There was talk of comparing Trumps current situation to that of Richard Nixon’s and the infamous Watergate scandal. During the mid 1970s in the height of the scandal, the S&P 500 cratered over 50% throughout the course of the year. As per usual, whenever the market is caught off-guard by a jarring situation, especially a political one, investors seek the safety of gold and bonds. As such, gold was up more than $24 an ounce on Wednesday.
“This week political risk has caught up on the market but it’s still unclear whether it has any legs,” said a Deutsche Bank strategist in a note to clients Friday.
Since Wednesday, much of the fear has subsided and better news has surfaced regarding the current political situation. The rebound in stocks gained more traction on Friday, but gold demonstrated its beauty as an investment as it kept above $1,250 an ounce and didn’t give up much of its gains.
Are We In Correction Territory?
Posted on — Leave a commentJust days ago we brought you an article exploring the problems with high valuations in the equity market. We looked at why the Shiller P/E ratio offers warnings to investors given that the measurement is over 75% higher than its historical mean. Outsized stock values reflect heightened expectations. As a result, companies face the ever-increasing burden of growth. Today, investors appear to be awakening to the fact that stock prices are unreasonable. Simultaneously, actions from China are compounding the problems looming for equity investors. These two factors offer reasons to refocus on gold as part of a portfolio.
The U.S. stock market plummeted on Wednesday. This drop comes amid increasing political turmoil. Investors, once hopeful for pro-business initiatives, are losing confidence that the administration will deliver on promises. Recent share prices have reflected this optimism, until now. For months investors have been paying today for value expected tomorrow. However, in the last several days tomorrow has started to look cloudy. “Equities are selling off significantly, the impeachment talk has been amplified since last night… It’s just natural that safe haven assets are doing well,” remarked a senior marketing strategist at RJO futures.
The data supports his argument. On Wednesday gold prices jumped to a two-week high. In fact, gold prices have climbed for six consecutive sessions. Troubling headlines and uncertain investigations have distracted policymakers from progress on the changes already priced into equities. It’s too early to know if this is the beginning of the end for the rally in stocks. However, the bull market is nearing a decade and cannot continue forever. Some have already made comparisons to market data from the Watergate era when the S&P 500 lost nearly half its value in less than two years.
Meanwhile, the picture abroad is no more encouraging. Lending in China continues to add to the list of investor woes. Excessive credit has threatened to overheat their market. To prevent this problem the country has recently increased rates. This increase, in turn, has squelched growth. The National Bureau of Statistics reported that value-added industrial output increased by 6.5% year-over-year in April. The problem: this figure was lower than March and well under expectations. Now China is pushing rates down in an attempt to pull off a tightrope act.
Some investment advisors aren’t reassured. A recent survey of 213 asset managers showed that 31% cited China as their biggest concern. Even optimistic readings indicate China will have a less positive effect on the global economy this year.
How can investors respond to a deteriorating picture? Asset class diversification offers some solutions. With greater exposure to gold, there is less reliance on equities. This sentiment has likely been a major reason for the latest surge in gold prices. Long-term equity investors often remark that time restores wealth even amid a downturn. Despite this truth, it’s important to remember that it took nearly 15 years for the Dow to reclaim its 1966 high. Downturns can last much longer than many consider.
Rare Coin Market Mostly Steady in April
Posted on — Leave a commentThe rare coin market held mostly steady in April, as U.S. investors continue to chase overvalued equity shares. Relatively tame inflation has also kept rare coin values roughly steady in the first few months of 2017. One index that tracks 87 U.S. rare coins revealed a slight retrenchment in April, but values remain sharply higher over the last ten years.
If you’ve invested in gold and silver bullion, but haven’t diversified into rare coins, current price levels offer an attractive entry point.
A Budget Everyone Can Afford
You’ve heard about the importance of diversification in the stock and bond market. It’s important within the tangible asset area too. There’s not a high bar to get started. Some rare coins – the Morgan dollar as an example – could be bought for around $20. More scarce rare coins have sold in the millions.
Investing in rare coins offers long-term investors’ greater diversification within their tangible asset portfolio and also the potential for more significant price appreciation over the long-term.
Here are three things to get you started.
Focus On Rarity and Condition
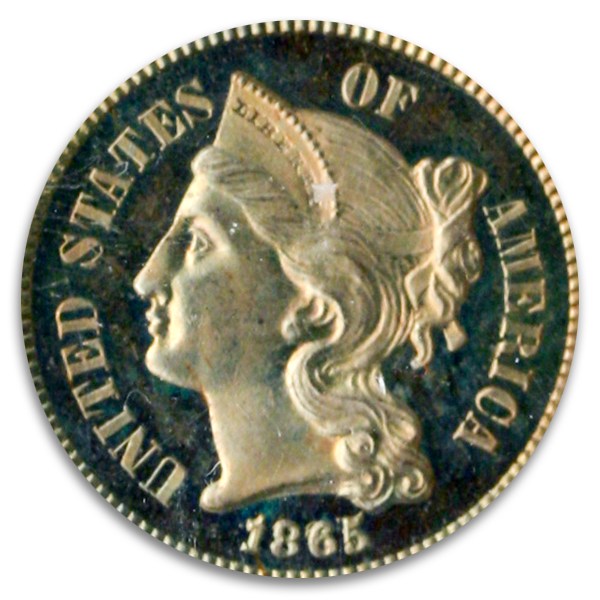
Rare U.S. coins are typically defined as those ones minted between the late 1700s and 1933. Market value of rare coins are generally assessed from both by their scarcity and their condition. There are third party grading and certification services that rank coins on a scale of 0 to 70. Typically, rare coin investors will want to focus on those graded above 50.
Build Sets
You may have heard the saying the whole is greater than the sum of its parts. Rare coin investors can improve overall returns by building sets, or groups of coins that are related.
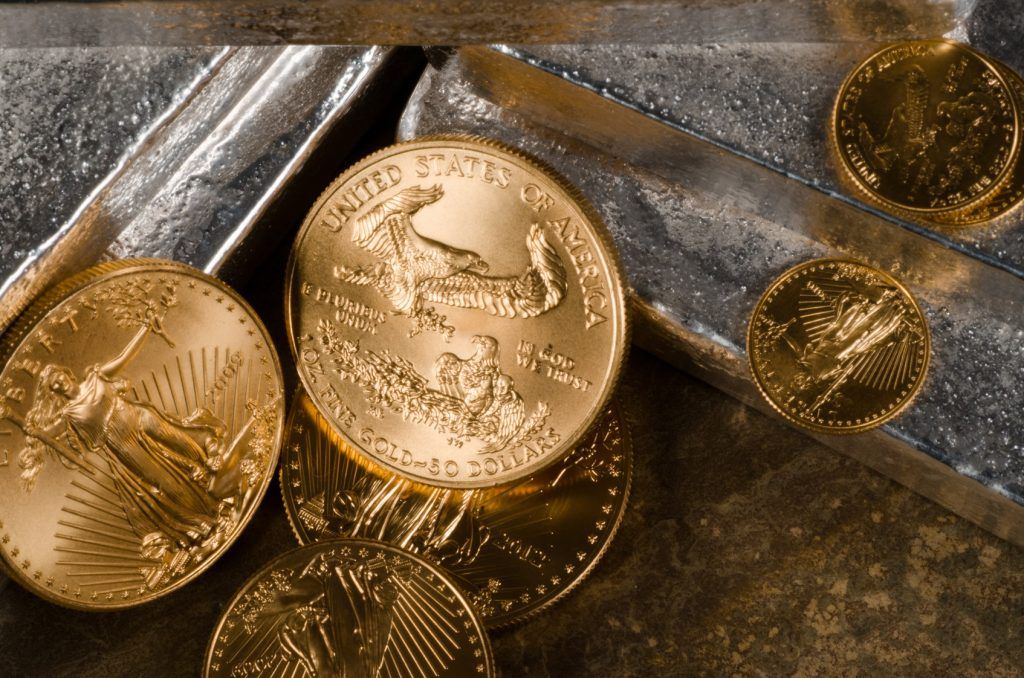
One example of a set is to collect U.S. Double Eagle gold coins that were first minted in 1849 and last made in 1933. There are six coins in the U.S. Double Eagle U.S. gold set that can fit just about anyone’s budget.
Build Your Long-Term Wealth
Investing in rare coins as a portion of your overall portfolio can help you increase your total long-term returns. Blanchard and Company partnered with Raymond Lombra, senior advisor to the Dean and professor of economics at Penn State University to conduct long-term market research on the impact of gold and rare coins on a portfolio during inflationary periods.
Here are key takeaways from the study:
- Portfolios that contain at least some gold or rare coins outperform those that don’t
- Rare coins deliver higher average annual returns than gold bullion
- Rare coins provide an excellent hedge against inflation
You win with rare coins in two ways. They hold value as a scarce collectible and also show an impressive long-term return and a hedge against inflation.
At Blanchard, we have hired the best numismatist in the country to personally purchase and curate every coin that we sell. Any coin that we sell has been reviewed and graded in advance, and we will buy back any rare coin that we have sold at any time at the then current market price. We are a family run firm with over 40 years of history and integrity you can trust.
Investor Fear Just Reached a 23-Year Low Last Week
Posted on — Leave a commentDuring trading on Tuesday of last week, the CBOE VIX index fell to 9.56, a level not seen since 1993. Although the VIX climbed above 10 later in the week, everyone on Wall Street was buzzing about the record breaking level of low volatility. But what does this mean for the typical investor?
Well, the price/level of the VIX is derived from the pricing of near-term options on the S&P 500 index. A low VIX level equates to cheap options premium, and thus, narrow trading ranges and an absence of fear in the market. Many analysts were baffled that volatility and investor fear could be so low amid foreign presidential elections, unprecedented domestic political change, and reoccurring nuclear threats from North Korea. Despite all of these potential threats, and more, the VIX sank to a multi-decade low.
However, the VIX was not the only index that set a record last week. On Monday, the S&P 500 index hit a fresh all-time high of 2,401.36. The new all-time high was mostly driven by upbeat earnings announcements. Despite briefly rallying on Monday, disappointing earnings from a few of the main retail clothing stores weighed on the market in the final trading days of the week.
Nonetheless, given that stocks are staying near their highest levels in history, a low amount of fear in the market seems reasonable.
“Overall the economy is still growing, unemployment is still extremely low, inflation is very much in check and the US Federal Reserve is raising rates but at a very low pace. I think all that is positive for risky assets.” said Mandy Xu, derivatives strategist at Credit Suisse.
Essentially, a stock market that just keeps climbing, like we have now, seems to be the perfect recipe for a very low VIX. But if the past offers any indication of the future, it might not be entirely smooth sailing ahead. There is a noticeable correlation between low VIX levels and sudden market sell-offs.
When the VIX dropped below 11 for the first time in years on August 6th, 2015, preciesly18 days later on August 24th there was one of the worst intraday market crashes in history. The S&P 500 cratered as much as 10%, the VIX subsequently soared above 50, and spot gold climbed double digits.
The logic behind quickly transitioning from a low volatility environment to a high volatility environment is primarily attributed to the fact that investors are not pricing in any wild price fluctuations. Because of this, investors can rapidly and easily be caught off guard when the market turns against them and positions are not hedged due to low fear sentiment, i.e. a low VIX.
Only time will tell if the historic low in the VIX made last week will precipitate imminent stock market turmoil. One thing is for certain, however, if a little market chaos is indeed lurking around the corner, those who stand to benefit the most are gold owners.
Diving Below The Surface of a Complacent Market
Posted on — Leave a commentToday, the stock market resembles the calm surface of a quiet ocean. The CBOE VIX Index (the “Fear Gauge”) recently reached a 23-year low. This standard measure of anticipated volatility in the equities market reflects a broad sentiment of complacency among investors. The market doesn’t expect a significant upswing or downturn anytime soon.
More than ever, the market seems is willing to shrug off major events. “Brexit” has exerted little impact. Trump’s election has only helped stocks, and even the recent news of Comey’s firing has done little to destabilize investor confidence. However, below the surface, there is reason to question the future of equities even for passive investors.
Too many investors see calm markets without considering one important number, the Shiller P/E ratio. In short, this single number measures valuation among the stock market. The calculation divides a stock’s price by its earnings while adjusting for inflation.
A high Shiller P/E indicates stocks are highly valued and expensive. A lower figure means stocks are cheap. Today, the Shiller P/E is 29.7. Why is this finding significant? At 29.7 the Shiller P/E is 76% higher than the historical mean of 16.8.
Moreover, this figure sometimes called the cyclically adjusted price-earnings ratio (CAPE), is the highest on record except for 1929 (market crash) and 2000 (dot com bubble bursting). Over the decades, a clear pattern has emerged. Heightened Shiller P/E ratios tend to occur shortly before a significant market downturn or “correction.”
The problem with a high figure like this is that it reflects the astronomical expectations of investors. At such high valuations and expensive prices, stocks will need to deliver outsized returns to justify their share prices. What if they fail? If these companies are unable to deliver, the market will fall.
Does this mean investors should expect a crash? The answer is no. However, these numbers should instill a sense of vigilance. Volatility might be low amid a soaring equities market, but valuations are equally high. This dichotomy sets the stage for disappointment. Meanwhile, increasing uncertainty surrounding the U.S. political landscape is building. Shiller, the man behind the formula, remarked in Q1 of this year that it’s “high enough to worry about.”
Shiller continued by suggesting “reducing your holdings of stocks, especially for a long-term investor. We can’t time the market accurately, but we know that when it’s this high, over the long term, it usually doesn’t do great.” These comments come from a man who won the 2013 Nobel Prize in Economics.
Equity investors take note. Today’s market might be sending signals that diversification is more important than ever. No one can forecast a crash or proclaim that one is imminent. However, a smart read of the market gives investors reason to reconsider their asset classes. Being too heavy in stocks without an exposure to uncorrelated assets like gold is dangerous because it leaves risk unbalanced.
Investors can take this early opportunity to reevaluate their portfolio to ensure they’re safeguarded in the event we see a market resembling 1929 or 2000.
$20 Billion in Gold ETFs Doesn’t Buy What It Used To
Posted on — Leave a commentSome are questioning if active investment strategies are dying. “Investors have pulled $304.7 billion from active U.S. funds in the past 15 months,” reports The Wall Street Journal. Investors have awoken to the higher costs of active funds and tepid performance which often fails to outperform or even match the broad market. Meanwhile, passive investment products are soaring amid a gain of $735.5 billion over the same period.
The frenzy is reaching the gold mining ETF market. “In the past six months, waves of money rushed into a $20 billion complex of interlinked exchange-traded funds that invest in gold mining companies,” explains The Wall Street Journal. Some of these ETFs have taken in $1.4 billion since September. Inflows of this size are starting to change the markets. When this much capital rushes into an ETF within a short period, the funds must purchase more shares. These movements can create problems.
For example, a gold ETF may close its doors to new investors. The reason: fast ascending share prices exceed the value of the underlying assets. Managers and investors are learning that widespread devotion to a passive approach has its problems. In previous articles, we’ve explored why gold ETFs fall short of the benefits offered by holding the physical product. However, here we see a new reason in the form of unwarranted prices. Moreover, these surging share prices appear to stem from investor excitement over passivity rather than the inherent value of the assets.
These recent events illustrate how gold ETFs can create unintended consequences. As a result, some analysts warn that markets will become less efficient. In extreme examples, a publicly traded company might discover that their largest shareholders are a few large institutional investors. These monoliths capture more shares as their index funds pull more passive investors into the fray.
This problem is systemic. As a public company’s market share increases, an index fund would need to follow suit. That is, the fund would need to buy more shares to become more representative of the market. This cycle means the company’s share price continues to ascend due purely to reactive moves from an index fund rather than profitability or sound management decisions. “Some studies suggest stocks included in popular indexes sport higher valuations and tend to move in lockstep with one another instead of responding to fundamentals,” explains The Wall Street Journal.
Ownership of physical gold presents an elegant solution to this problem because it’s free from the fluctuations arising from capricious ETF inflows. Commodities like precious metals are comfortably outside the whirlwind of tumultuous investor psychology. True gold investors seek the metal because of its rarity and not the complexity of leveraging and derivatives common to ETF shares.
The problem is getting worse as momentum towards passive investing grows. “Nearly one in every $5 invested in stock funds is invested in an index fund, up from less than one in every $10 in the year 2000,” explains one journalist at CNBC.
It’s ironic that investors identifying themselves as passive are unwittingly exerting powerful force upon the market.
Is Your Uber Driver Giving You Stock Tips?
Posted on — Leave a commentOptimism, excitement and euphoria. Those are typical emotions seen at market tops. Wall Street insiders know that the “public” or regular Mom and Pop investor are usually the last ones to join into a stock rally.

The joke goes when your hair dresser or your taxi driver are giving you stock tips, you know the current rally has reached its exhilaration phase.
Wall Street took heart in the passage of the Health Care Reform bill in the House last week. That is the first step toward enactment of a “repeal and replace” plan for Obamacare. The stock market remains in an ebullient mood as the major indices climb to new record highs.
Can Congress Deliver For the Economy?
The health reform bill’s passage in the House was viewed as the canary in the coal mine and viewed as a positive indication that Congress can indeed deliver on President Trump’s legislative agenda.
It is easy to get caught up in the euphoria of higher stock prices, but investors who are pouring fresh money into equities right now are late to the party.
- Last week’s House health care bill passed by a narrow margin of 217-213. Notably, 20 Republicans crossed the aisle to vote against the bill.
- The next step involves the Senate and it is generally agreed the health care reform bill cannot pass in its current form there.
“The timeline for the bill remains highly uncertain, but it is likely that the process in the Senate will take longer to resolve compared to that in the House and may possibly take several months,” says Mark Doms, Senior Economist at Nomura. “This timeline could adversely affect Republican tax reform efforts in Congress,” Doms adds.
What Does This Mean For Markets?
If the Republican controlled Congress is unable to pass a repeal and replace law for health care, it calls into question what type of tax reform will be enacted.
Many on Wall Street expect a significantly watered down version of the current tax proposals to be enacted. That means less lift to the economy overall.
“We hold to our earlier expectation of a modest tax cut, instead of full-scale tax reform, as the most likely result. A modest tax cut would require much less time on the legislative calendar compared to comprehensive tax reform,” Doms says.
The stock market rally is being fueled by hope, euphoria and Pollyanna optimism that major reform will be enacted. Investors with long memories will remember how the Dot.com crash quickly unraveled in 2000.
How You Can Protect Your Assets
Gold has historically zero correlation to the S&P 500 (0.02) it has provided a proven diversification benefit to investors who have a large part of their retirement assets in stocks.
The current cycle in stocks will turn. It always does. Bull markets don’t last forever. Don’t get caught up with the crowd. No, your Uber driver doesn’t know more about the stock market than the Wall Street experts. Take the time to prepare your portfolio now.
Markets Advance for Third Straight Week
Posted on — Leave a commentIt was another solid week for US stocks with a host of positive earnings reports and upbeat economic data giving a nice boost to prices. Eight out of the ten sectors in the S&P 500 were positive on Friday; the health-care and financial sectors lagging behind.
The reason stocks are not entirely green across the board, particularly in the health-care sector, is thought to be associated with Thursday’s passage in the House of a revamped health-care reform bill. There is still a sizeable amount of lingering political uncertainty as a result of the bill’s initial success. Next up is the Senate, where passing the bill might prove to be more of a challenge.
Regardless of future policy change, company earnings are robust, and this is probably the single biggest driver of the market. Analysts anticipated a 9.1% rise in corporate earnings for 2017 from the year prior, and with over 400 companies reporting, earnings are currently on track to rise 13% YOY, according to Factset.
Technology companies in the S&P 500 and the Nasdaq 100 have seen the most growth since last year. Currently, the S&P 500 technology sector is up about 17% from a year ago, which is quite impressive.
In response to the strong tech sector, Ketu Desai from i-squared Wealth Management said, “in an economy with 2% or 2.5% growth, these companies are growing at double digits. They’re going to be the engines of growth for the economy.”
But they are not the only sources of growth for the market. April’s jobs report released on Friday from the US Bureau of Labor Statistics showed a sharp increase from last month with 211,000 new jobs created in April. Economists were expecting the number of new jobs to be around 185,000. Unemployment levels also defied expectations as they sunk to a fresh new low of 4.4%, not seen since before the financial crisis in 2007.
“It calms the folks that thought we were headed toward a labor market slowdown,” said Sameer Samana, global quantitative and technical strategist at Wells Fargo Investment Institute.
Strong jobs reports often lead the Fed to tighten monetary policy, because the overall economy is growing and seems healthy enough to withstand rising interest rates. When this happens, non-interest-bearing assets like gold and stocks can often lose their appeal.
Gold has had a rocky start to the month. Gold fell through support at $1,250, but is still well above the key level of $1,200. The long-term case to own gold seems to still be intact.
For other commodities, crude oil rebounded from a new of 2017 that was formed on Friday. Concerns about oversupply and the lack of demand have been unequivocally plaguing the oil market. When oil has large negative price movements and spills over into the stock market, it usually adds downward pressure for stocks, but since crude rebounded it actually aided the energy sector and stocks in general on Friday.


