Gold and Economic Uncertainty: Why Investors Are Paying Attention

Sluggish Housing Data Reveals Cracks in Economic Outlook
The U.S. housing market is nearly frozen. With mortgage rates above 7% and the median home price surging to a record high at $440,660 this summer, homebuyers face a major challenge getting the keys to their own home. That’s showing up in the data.
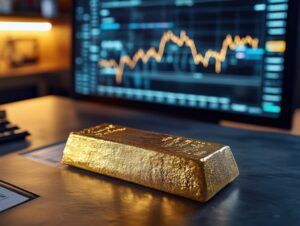
Gold ticked higher on fresh news that U.S housing starts and building permits slumped in August. Gold climbs during weak economic environments and is seen as a hedge against recessionary environments.
Economic Snapshot
• U.S. housing starts fell 2.6% in August to 1.275 million, according to the Commerce Department.
• Residential permits also declined in August, falling 2.7% to 1.394 million.
• Year-over-year pending home sales declined in all four major U.S. regions. “Nationally, contract signings today are running roughly 30% below where they were in the years leading up to the pandemic,” said NAR Chief Economist Dr. Lawrence Yun.
• Big picture: The Leading Economic Index (LEI) fell -0.1% in August.
What it means for the economy:
These indicators came in worse than expected. Economists expected housing starts to rise 4.9% to 1.3 million and permits to come in higher at 1.4 million. Affordability is a major challenge for Americans who want to become homebuyers.
What this means for gold: Gold climbed following the weak housing market because real estate struggles often signal broader economic slowdowns, triggering monetary policy shifts and safe-haven demand.
In late 2026, the U.S. economy faces a bewitching combination of high inflation and signs of slower economic growth in some sectors, which can lead to stagflation. During past periods of stagflation in the U.S., gold stood out as one of the best performing asset classes as the stock market struggled and inflation ate away at the bond market’s value over time.
For centuries, gold, considered a safe-haven asset, has held and increased its value over time, making it a strategic long-term investment tool.
How gold performed during major historical events:
• Great Depression 1929 to 1939: stocks down 90%, gold up 67%
• Great Inflation 1965 -1982 (inflation topped 14%): stocks down 52%, gold up 970%
• Dot.com stock crash 2000-2002, stocks down 77%, gold up 25%
• Great Recession 2007- 2009: stocks down 50%, gold up 40%
Throughout wars, recessions, and financial crises, gold has steadily climbed higher. In 2016, the price of one ounce of gold stood at $1,250 per ounce. Today, gold trades at over $4,300, its price more than tripling over 10 years.
What comes next? J.P. Morgan says gold could climb to $6,300 in 2027 and Goldman Sachs expects new record highs soon. If you’ve been considering increasing your exposure to gold, today could be the lowest price you’ll see this year. Call Blanchard today. We stand ready to assist.