


Time is an Illusion, But Not if You’re an Investor
Posted on — Leave a commentGetting in and out of the market at the right time is everything. The problem, however, is that the right time is never clear until it’s too late. Humans aren’t good at predicting outcomes.

In 2001 author Robert Zuccaro famously declared that the Dow Jones Industrial Index would reach 30,000 by 2008. Today, we still haven’t reached 30,000. Moreover, his prediction year of 2008 market one of the most disastrous declines in the history of the stock market.
Then, there was economist Ravi Batra whose 1987 publication, “The Great Depression of 1990” became a New York Times bestseller. Then, the 1990s ushered in an era of economic prosperity.
Predicting is a losing game.
Perhaps this is why so many fail to recognize opportunity. Science shows that we are far too confident in our decisions. But, research into psychological shortcomings like confirmation bias, gambler’s fallacy, and the ostrich effect all reveal how the brain short circuits our decision process.
Gold investors would be wise to take note of these errors. Many recent headlines lament falling gold prices. They take a cautionary and depressed tone. They warn of recent drops in value. However, they all miss a key takeaway: declining prices leave investors with upside potential.
Getting into the gold market now means enjoying a relatively low-cost basis. That is, investors who buy low have a greater chance to see their investment in gold appreciate over the long-term.
Large institutions know this fact well. Consider that “After nearly two decades as net sellers, central banks collectively are now net buyers of precious metals (mainly gold), contributing to a decrease in supply and an increase in demand,” according to Morgan Stanley.
However, if this central bank buying is reducing supply, then why isn’t the price going up at the moment. The answer is found in the hundreds of biases steering investors every which way.
The problem is that we’re not wired to view circumstances in a long-term context. For early humans, the long-term didn’t extend much further than the next harvest. Therefore, it’s not surprising to see why it’s difficult for investors to consider that gold has outperformed stocks and bonds.
In fact, investors only have to look back 15 years to see that gold has delivered an impressive 315%. This performance outpaces the Dow Jones Industrial Average which earned just 58% over the same period.
The key to investing in commodities like gold is to preserve a long-term perspective amid the noise of headlines, talking heads and the incessant voice within that urges us to act irrationally.
1853: When the West Desperately Needed Coins
Posted on — Leave a commentIn 1853, California was in the midst of the Gold Rush. The massive influx of people into California created a demand for money for use in daily commerce.
While miners pulled gold nuggets out of rivers and the ground, the raw gold was not effective as a medium of exchange.
Californians Needed Coins
There simply weren’t enough coins for people to conduct their daily business of paying for food, lodging, supplies, clothing or entertainment.
People who flocked to the West had a deep distrust of paper money. They wanted gold coins.
Back East, the official response to address the money crisis and the need for adequate coinage was slow.
Many coin collectors know that the United States Assay Office stepped in and began minting Territorial coins to supply the frontier area with an influx of gold coins into circulation.
Private Gold to the Rescue
What is less well known, is that prior to the US Assay office, so-called “private gold” was minted by companies in California, outside of the United States mint.
Private gold was circulated out of necessity in the rural West due to the coin shortages.
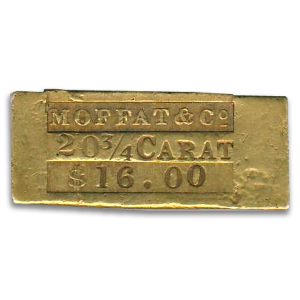
One of the largest and most prominent private gold coin firms: Moffat & Co. climbed to great importance during the Gold Rush Era.
Founded by New York metallurgist John Little Moffat, the firm developed an assay office, which was semi-official in appearance and character, despite having no official connection to the United States government.
In the summer of 1849, Moffat & Co. first produced small gold ingots. But, the locals did not favor these and the gold ingots never were accepted as a means of payment.
Trying again, Moffat used U.S. American gold coins as a model for some of his coins. Moffat & Co. employed Albrecht Kuner, a skilled Bavarian to create the dies for the five and ten dollar pieces .The dies were every bit as elaborate as official government coins. On the coronet of Liberty, the words Moffat & Co. replace the word LIBERTY, which was used in official United States government coins.
Ultimately, Moffat & Co. issued coins ranging in value from $9.43 to $264.
Moffat & Co. were in operations from 1849-1853. The firm sold its facility to the Treasury Department and in March 1854, the operation was reopened as a branch mint of San Francisco.
In 1854, a branch of the U.S. Mint finally opened in San Francisco to convert the miners’ gold into coins. By the end of that year, the San Francisco Mint produced $4,084,207 in gold coins.
Many gold Territorials and private gold coins were melted and turned into “official” gold coins.
Colorado Gold Rush
Around the same time in history, the Pike’s Peak gold rush in 1858 was Colorado was underway. Nearly 100,000 gold diggers descended upon the mountain territory seeking their fortune. The famed “Fifty Niners” were the first to arrive at the site and quickly mined the easy-to-reach gold deposits.
The same problem emerged in Colorado that had plagued California just a few years before. More raw gold than cash.
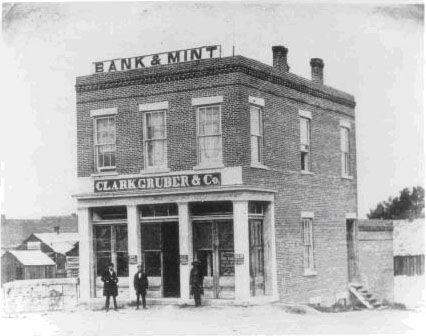
Like Moffat, another private company in Colorado stepped in to fill the gap. In 1860, brothers who had made a fortune already by selling groceries and everyday articles to the gold seekers founded Clark, Gruber & Co. Bank & Mint. They famously issued “private gold” in the denominations $2.50, $5, $10, and $20.
The Clark & Gruber coins featured the symbol of the Colorado gold rush on their coins: Pike’s Peak. The firm continued minting private coins until 1863 when the U.S. Treasury bought the firm.
The private gold coins that survived are exceedingly rare and prized by collectors around the world. The surviving private gold coins, like this one are bursting with history of a dramatic and exciting era in Western gold rush history. Imagine the stories this coin would tell, if it could talk.
The Mighty U.S. Dollar Roars Back To Life
Posted on — Leave a commentThe slumbering dollar bears have come out of hibernation. The U.S. dollar has roared back to life in recent months, climbing a solid 10% since its February low.
In the most simplified terms, that means the dollar bill in your pocket is now worth $1.10.
Your $1.00 bill can now buy 10 cents more than it did six months ago. Hint: If you are thinking of traveling abroad, you’ll likely get more bang for your buck now than in February.
Why is the U.S. dollar climbing?
The world of foreign currency trading is a zero-sum game.
That means for every winner, there is a loser.
Right now, the U.S. dollar has roared back to dominance on the world stage. The U.S. economy looks better than economies of many other G-10 nations, so that tilts favor toward the dollar. When the Federal Reserve hikes interest rates that also strengthens the dollar.
Bullish interest rate differentials
Global money managers compare official interest rates that are attached to each currency.
Essentially, the Fed is “paying” investors more to hold the dollar. The Fed’s official interest rate currently stands at 2.00%, while the European Central Bank’s interest rate stands at zero percent.
If you are a foreign investor with some money to park someplace, which would you choose? A savings account that pays zero? Or a savings account that pays 2%.
Two percent may not sound like much. Yet, a whopping $5.3 trillion dollars trades each day in the forex markets, according to the Bank for International Settlements. Two percent can add up quick on big money.
What does this mean for gold?
Gold is priced in U.S. dollars on the world marketplace. As the dollar strengthens that typically pushes the “price” of gold lower. There tends to be an inverse correlation.
If you’ve been waiting to buy physical gold, consider this.
When the U.S. dollar is gaining in the world markets, consumers are gaining purchasing power.
The flip side is true as well. When the dollar is weakening, consumers are losing purchasing power.
In essence, the stronger dollar means you can buy 10% more gold right now!
If you’ve been waiting for the “right time” to buy gold, this is it. Don’t delay.
Beware: Cycles Change
While the dollar is strong now, that hasn’t always been the case.
From 2001 to the 2008 low, the U.S. dollar index plunged 26%. That’s a huge move, and a massive decrease in purchasing power for American consumers.
The value of paper money rises and fall, especially as central banks have flooded the world’s money supply in recent years. When the U.S. dollar declines in value that means you can purchase less with it.
Right now, you’ve got a chance to buy more with the mighty dollar!
Gold is the world’s first currency and can help maintain the true purchasing power of your assets that are held in bullion and coins.
See how gold much your dollars will buy now
1 Oz American Silver Eagle Coin
We think you’ll be surprised.
Can It Get Worse for Bitcoin?
Posted on — Leave a commentIt wasn’t that long ago that Bitcoin traded above $19,000.

Today it trades at $6,304.
In the last three weeks, the price of Bitcoin fell 23%!
Volatility remains high.
Looking back, anyone who bought during that speculative buying frenzy that unfolded in November and December 2017 that rocketed Bitcoin to $19,343 on Dec. 16, 2017 is deeply underwater now on that trade now.
Ouch.
What happened?
The bubble burst, as all bubbles do. History is littered with bubbles famously starting with the Tulip bulb craze in Holland in the 1600’s.
- It has been said that Switser tulip bulbs skyrocketed 2880% in a little over a month.
- The roaring 1920’s ushered in a massive stock market rally and bubble, which turned into the Crash of ’29 and preceded the Great Depression.
- The mid 1960’s ushered in another U.S. stock market bubble led by the so-called “nifty 50” stocks.
- Japan saw a bubble in their stock market and property prices in the late 1980’s
- U.S. home values surged in bubble, which peaked in 2005-07.
The Bitcoin bubble of 2017 is just another one to add to the list.
What is A Bubble?
A bubble is an increase in asset prices based more on emotion than fundamentals.
Bubbles form because of human psychology.
Very simply, it’s human nature to want more. During a speculative bubble price run-up, people think: “if everyone else is doing it, I must be missing something. If others are continuing to put money into it, they must be seeing something I’m not and I better get in now before it goes higher.”
Lessons Learned
Emotions are part of investing. When it comes to bubbles, investors learn a hard lesson about speculation.
There’s nothing wrong with speculation.
A lucky few can get rich that way.
However, when you are speculating you can lose up to 100% of your investment.
Beyond the speculative risk, Bitcoin is a digitized investment – it is possible for you to lose your private keys or for a Bitcoin exchange to get hacked (both have happened).
- Any funds you are considering allocating to Bitcoin should be money that you can lose if the speculative trade goes south.
Why Is Bitcoin Falling Now?
Since late July, Bitcoin plunged 23%! The Bitcoin price dropped from $8,166 to $6,302 on Aug. 12.
Chaos emerged in emerging markets in recent weeks. Turkey is in the early stages of what may well be economic collapse.
The Turkish lira skidded about 30 percent lower from the start of 2018. That means Turkey’s debt (more than $450 billion), which is denominated in dollars and euros, just got 30% more expensive to pay off. That sent Turkish interest rates spiraling higher as investors demand to be paid much more to compensate for the higher levels of risk on debt repayment (or default).
Contagion is already happening in emerging markets. The Argentine and Mexican currencies dropped swiftly late last week.
Bitcoin fell too. Yep, Bitcoin is going down, not up.
So much for Bitcoin acting as an alternative currency asset during a crisis.
What does this imply? Bitcoin remains an unproven asset. The concept of a digital currency remains unproven, is still in its infancy and has many challenges to overcome before widespread adoption and use in daily transactions could become feasible.
What Next?
Circling back to the title of this piece: Can it get worse for Bitcoin? The answer is yes.
Charts don’t lie. Bitcoin prices have been trending lower all year. The trend is down.
If Bitcoin breaks technical support at the $5,800 area, the next target comes in at $3,200.
The odds favor that Bitcoin will hit $4,000 before we see $10,000 again anytime soon.
Share Your Stories
Bitcoin has attracted the interest of investors from hedge fund managers to high school kids who are mining for Bitcoins from the home laptop. If you are intrigued by Bitcoin, you aren’t alone.
What Research Tells Us About Gold During Downturns
Posted on — Leave a commentDon’t worry about a financial doomsday, if it comes you’ll be sipping iced tea on the beach. Science proves it.

A chain of record-breaking gains in the equity market has made investors nervous. They’re asking “how much longer will this last?” In 2017 the Dow Jones Industrial Average saw 70 record closings. Meanwhile, the S&P 500 hit 69 record closes in the year.
In January of this year, the Dow surged 322 points to close above 26,000 for the first time. Investors are fearful that Newton was right. What goes up must come down. Way down. While no one can accurately predict the next crash or correction, most agree that stocks will come back to Earth. After all, we’re 10 years into the bull market.
So how does an investor reliably shield themselves? Researchers have learned that “empirical results show that gold is a safe haven for stocks.”
Their research shows that gold functions as a safe haven for approximately 15 days. Any seasoned investor knows how much can happen in 15 days. In fact, it took only one day for the Dow to fall more than 22% in 1987. However, for gold to behave as a true haven during periods of turmoil in the stock market, investors must remember a few essential rules.
They found that investors who “purchase gold only after an extreme negative shock occurred” didn’t receive any of the protection they needed. Buying late in the game only decreases the portfolio’s value.
Part of the researchers’ inspiration stems from prospect theory. The idea, created and developed by Nobel Prize winner Daniel Kahneman, argues that people value losses and gains in different ways. For this reason, the theory is sometimes called “loss-aversion.” The theory suggests that people will make different decisions about where to invest based on how that investment’s performance is presented.
If the investment is presented in a way that highlights periods of decline, then most avoid it. If the same performance is described with language highlighting the periods of positive performance, most investors will jump in.
Humans are tuned to how others “spin” it.
During a boom period for equities, investors see plenty of positive spin. They see record-breaking years like 2017. They perceive the probability of a gain as something greater than what is really presented.
The study illustrates not only gold’s power but also the psychological biases governing our decisions. The more investors become aware of these biases, the more they can do to counteract them. These findings are significant for long-term investors because after a major negative stock return “the figures show a relatively constant gold price.”
You can’t control the market, but you can control your exposure to downside risk with safe-haven assets like gold held over the long-term. “The key characteristic of a safe haven asset is the fact that it is effective in extreme market conditions in contrast to a hedge that is only effective on average but not necessarily in times of market turmoil,” write the researchers.
Get that iced tea ready!
When a Gold Giant Throws in the Towel
Posted on — Leave a commentBarrick Gold Corp is the world’s largest gold producer and they haven’t had a CEO in nearly four years. That’s their second largest problem.

The company’s gold production has dropped more than 25 percent since 2013. Production is expected to fall even further. Part of the reason for the drop: Barrick’s Executive Chairman John Thornton is shedding some of the company’s assets. The company owns about one-third of the mining operations held when Thornton first took over. Recently, the company reported a negative free cash flow. Finding gold isn’t as easy as it used to be, and it was never that easy in the first place.
The strategies behind the world’s largest gold producer offers clues about global production. As Thornton remarked, “We are nowhere near where we want to be.” This statement reflects why Barrick might right size their operation and give up their status as number one.
In February of this year Barrick predicted its eighth straight drop in annual production. Meanwhile, the cost of producing an ounce is climbing. The company cited “lower anticipated gold production from Barrick Nevada, Pueblo Viejo and Veladero.”
Meanwhile, the second quarter of this year marked the seventh consecutive quarter of year-over-year growth in gold demand from the tech sector. If Barrick is any indicator, future global gold production will sink. Many expect the company to sell its mines in places like Australia, Africa, South America and Canada. Selling would reduce Barrick’s footprint to the U.S.
Barrick’s moves signal the increased difficulty of finding gold. Demand, however, will rise. China’s emerging middle class wants gold. Industries like energy, healthcare and technology will all require more gold. More buyers will enter the market with the ease of investing apps. Many gold miners carry heavy debt burdens. These capital restrictions limit exploration and new finds.
Research from the World Gold Council shows that, “The rate at which gold is being discovered has declined over the past three decades, even though exploration budgets have risen almost continuously since the early-2000s.” The deposit miners are finding are not as large as they once were. Large deposits, called “World Class Finds,” have dropped off.
These problems have plagued companies like Barrick. However, for gold investors it could mean wealth creation. Those who buy now are entering the market when global players are forecasting fewer finds. As the law of supply and demand takes hold investments could rise.
Of course, increased difficulty in mining doesn’t mean companies will quit. They will continue to dig, but it will cost them more to do so. In time, this trend could also boost the price per ounce of gold. Improved mining technology will help, but only to an extent. Many of these new tools bring efficiency to mining. They don’t make it easier to find gold. Supply is king of the equation and as Barrick’s recent history shows, supply is slipping.
The Enduring History of The Clark Gruber Coin
Posted on — 3 CommentsIt’s been said that the way to make money during a gold rush is to sell shovels. However, a few clever men decided instead to earn their riches building a mint.
In the late 1850s a few lonely gold prospectors discovered 20 troy ounces of gold in the small town of Little Dry Creek. Today the area is a Denver suburb, but back then it was part of the sprawling frontier promising wealth. Stories of Rocky Mountain gold spread. The outpost grew.
Miners from across the country descended on Little Dry Creek and other neighboring areas. The industry developed and infrastructure followed. Newcomers needed food and lodging. Those lucky enough to find gold needed a way to convert it to coins. Emanuel Henry Gruber saw an opportunity. Along with his business partners Austin and Milton Clark, he established a brokerage firm office in Denver.
In July of 1860, the men opened the Clark Gruber and Company private mint. The operation was nothing more than a two-story brick building. They began by minting $10 gold pieces. Eventually, they added a $20 gold piece. Each featured a relief image of Pike’s Peak with an image of an American Eagle on the reverse. In just three years Gruber and his partners minted more than half a million dollars’ worth of gold coins. The business also shipped gold. Gruber and his partners sent parcels containing gold dust to the Philadelphia mint for processing.
Gruber, it seems, was too adept at spotting opportunity. After these first three years the US government saw the potential of Colorado’s mines and set up an assay office with the purpose of formally testing the purity of the gold in the area. To do so, they bought Gruber’s mint for $25,000. Coin production stopped. The office decided instead to simply stamp gold bars indicating weight and purity.
By the early 1900s Denver started construction on their own mint. In the first year of operation the mint produced more than 167,000,000 gold and silver coins with a total estimated value of approximately $27 million.
Today, the Clark Gruber coins are a vestige of another time. The smooth finish represents an era in which prospectors unearthed their dreams with a pickaxe and boots. The Pike’s Peak gold rush saw more than 100,000 hopefuls pass through the territory in search of wealth. It was an echo of the California Gold Rush. Enthusiasts famously stated, “Pike’s Peak or Bust!” Some even braved hundreds of miles of travel through the punishing Colorado winter to get a head start on the boom.
In time the saloons and post offices became ghost towns eroded by the seasons. While the log cabins and town halls crumbled Gruber’s coins endured. Today, collectors can hold a piece of US history with one of his coins. It was the piece that gave rise to the Colorado Territory and the identity of America as a place of wild expanse hiding fortunes.
The Denver mint is operational to this day. The operation boasts a daily production that can run as high as 50 million coins. To date, Denver has minted more than 300 billion coins.
The Scary Secret Behind 4.1% Economic Growth
Posted on — Leave a commentDid you hear? The U.S. economy grew by 4.1% in the second quarter. Should you cheer? Not so fast.

The scary secret that few are talking about is the hidden cost of the goosed up economic growth.
The massive corporate tax cuts passed in late 2017 are indeed having a short-term impact.
- Stocks are climbing.
- The economy is growing.
This is artificial stimulus that all Americans will pay for heavily down the road. Plus interest.
The tax cuts passed in 2017 added to the fast-growing federal debt. The government is on an unsustainable path of cutting taxes (reducing inflows to Treasury), while it ramps up spending even more.
- The federal debt now stands at a massive $21.2 trillion.
- If the government were an individual, this would be like someone opening up 4 new credit cards and maxing out spending, while they are bringing in less income.
Here’s what the conservative Heritage foundation had to say:
“Congress is bankrupting the country and robbing future generations of Americans to pay for it,” said Tommy Binion, Director, Congressional and Executive Branch Relations of The Heritage Foundation.
“The Bipartisan Budget Act increases spending by $386 billion over two years and nearly $1.5 trillion over 10 years. It also suspends the debt ceiling until after the next election,” Binion said.
“This is a massive and sweeping increase in federal spending. The increase in domestic spending is three times larger than even the increase requested by President Obama in his last budget,” he added.
- Extra spending and lower tax rates helps in the short run: that’s why we saw a jump in GDP to 4.1%.
What Can We Expect Next Year?
“This is an aging nine year-long in the tooth economic expansion. And those tax cuts, are a one off, you only get the spending boost for one year, and unless you cut taxes again the next year, there won’t be additional tax cut monies to line company and consumer pocket books,” said Chris Rupkey, Managing Director and Chief Financial Economist at MUFG.
“Growth going forward has a lot of headwinds, especially given the graying of society where baby boomers will stop spending as much and the decline in the national birth rate will also spell slower growth in the years to come,” Rupkey added.
“Pop the champagne today, but don’t get used to it. In the long run, we are all doomed,” Rupkey concluded.
Russia Dumps U.S. Debt, Buys Gold
Interestingly, Russia is no longer so keen on holding American debt.
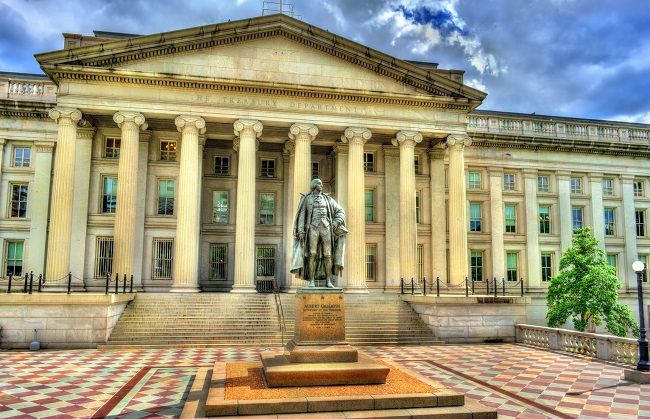
In mid-July, the U.S. Treasury released a list of the top 33 national investors in our country’s bonds. Russia, previously in the top 10, was absent.
- In fact, Russian ownership of U.S. Treasury bonds slumped from $96.1 billion in March to an 11-year low of $14.9 billion in May, the most recent Treasury figures show.
What are they doing with the proceeds from the U.S. bonds they are selling? Buying gold.
Russia recently overtook China in ownership of gold, with total holdings now standing at $80.5 billion, according to the Business Insider.
Russia is “moving from a safe asset to an ultra-safe asset,” Padhraic Garvey, the global head of debt and rates strategy at ING, said in news reports.
Gazing into the Future
America’s rising debt levels are dangerous and leave us all vulnerable to dramatically higher interest rates in the future, higher taxes and lower spending on entitlements like Social Security.
Here’s what the Council of Foreign Relations recently said:
“If the debt continues to grow at an unsustainable level, it could expose the country to a number of dangers, economists say. In the extreme, the risk rises that Washington’s lenders, many of whom are foreign, could suddenly lose confidence, demand higher interest rates, and potentially trigger a fiscal crisis. Short of that, the rising debt could gradually squeeze discretionary spending and deny the country tools it needs for security and economic stability. Bringing the debt into check, experts say, will likely require politically difficult decisions to either curb entitlement spending, significantly raise taxes, or both.”
What Can You Do Now?
There’s never been a better time to buy physical gold. Russia is dumping Treasury securities and buying gold. That’s a warning signal that other foreign nations might stop holding our debt too.
Unless our policymakers begin to act responsibly, going back to the credit card example, the credit card companies are going to impose higher interest rates and not allow you to charge anything else on your card. The situation is getting dire. Take action now to protect your assets. Kings, governments, wealthy individuals and money managers turn to gold century after century because of its inherent value and ability to store, preserve and protect your assets. Why not you too?
Feeling a Bit “Flat”? Here’s Why
Posted on — Leave a commentDespite surging GDP growth and a strong employment picture, some analysts are starting to feel a little “flat.”
The yield curve is the yield spread between long-term and short-term U.S. Treasury bonds. This graphed line has long been a popular economic indicator. Today, the curve is starting to flatten, and that has some worried. The reason: a flat yield curve brings us closer to an inverted yield curve, which, historically, has been followed by a recession.
The pattern unfolded during the dot com bust of 2000 and again during the global financial crisis starting in 2008. Financial forecasters call this “economic deceleration.” The rest of us call it “hard times.”
One fact is clear; the curve is not invented yet. It’s starting to get closer to that position, but for now, we aren’t there. The bending, and flexing of the curve has implications for gold investors because “investors have generally benefited from holding gold during periods of economic deceleration,” according to The World Gold Council.
However, some, like those at Morgan Stanley, are taking a contrarian position and explaining that the flattening curve “sends a weaker predictive signal about the future state of the U.S. economy than it has in the past. They continue, explaining that “we’re not worried about an impending recession since we believe that today the slope of the yield curve sends a weaker signal and it would therefore take more flattening than ordinary to have the same impact on future growth than it had in the past.”
Even if the “danger” signal isn’t blinking yet, gold investors may want to take note because historically, gold has experienced an upswing in value during periods of rising inflation. Recently, inflation has ascended to target levels with the US hovering around 2.5 percent and the Eurozone at about 1.9 percent. This upward movement has been long in coming. In recent years inflation has remained stubbornly low.
The World Gold Council suggests that recent decreases in gold’s value might increase customer demand given that lower prices support jewelry purchases. Simultaneously, they illustrate a historical seasonality to gold as illustrated by softer demand and diminished trading in the summer months with a clear uptick in September. This data, coupled with rising concerns of an inverted yield curve, might leave gold enthusiasts positioned for a window of opportunity.
As always, the appropriate plan is one with a long-term perspective. Whichever way the yield curve bends, gold has a place as a diversifier in any portfolio. Moreover, as future expectations for long-term equity returns start to cool, investors will need new ways to find growth. Consider that in the most recent, incomplete cycle, equities have returned only 5% annually, and “JPMorgan predicts returns of 3.3% for the S&P 500 over the next decade,” according to The Wall Street Journal.
Part of the reason for this tepid outlook is the currently high valuations. Companies will need to boost their already strong performance to validate and surpass these valuations. The yield curve, seasonality, and easing equity returns all give investors reason to consider gold.
3 Reasons You Should Ignore the Death Cross in Gold
Posted on — Leave a commentThe financial news networks have been abuzz talking about the “Death Cross” that appeared on the gold chart this summer. A Death Cross sounds pretty scary. Don’t worry, it’s not.
A Death Cross is just a term that traders use when the 50-day moving average falls below the 200-day moving average.
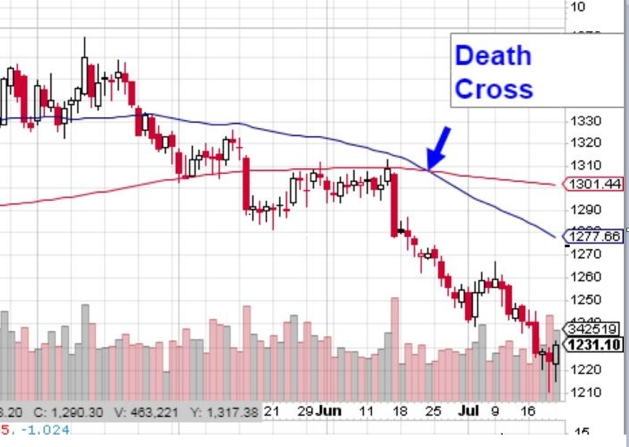
That was an invitation for Day Traders to jump on the short selling bandwagon, which pushed the gold market lower in recent weeks.
You’ve heard the saying: Markets Aren’t Rational. This is a classic example of where that applies.
The gold market is being driven by day traders who are running the market lower based on the Death Cross.
Here’s why you should ignore the Death Cross: the “fundamentals” are getting increasingly out of whack for the price of gold.
3 Trends to Drive Gold in the Second Half
The World Gold Council just released a new report pinpointing the three factors that will drive the price of gold in the second half of the year:
- Positive but uneven global economic growth
- Trade wars and their impact on currency
- Rising inflation and an inverted yield curve
A trade war could be one of the greatest risks to not only the American economy but the global economy in the months ahead. Read more on that here.
Inflation just hit a 6-year high, the Labor Department reported in mid-July. That wipes out wage gains for the average American, according to the Chicago Tribune.
An “inverted yield curve” is another technical term, but guess what? It’s also a solid Recession Indicator.
- The last seven out of seven times the yield curve went negative since the 1960s, a recession followed, according to CNBC.
It refers to when short-term interest rates rise above long-term interest rates. It’s starting to happen now!
The Day Traders who’ve pushed gold prices lower are doing Long-Term Gold Investors a big favor: they are creating better price levels to enter the market!
Here’s what the World Gold Council said: “Gold’s recent pullback is supportive of consumer demand, as low prices tend to spur buying; at the same, it may provide attractive entry levels for investors.”
The Gold Tide Is Turning
While for short periods of time, markets can become “irrational” and day traders can create market prices that are out of whack with the macro economic outlook. That is exactly what’s happened in gold this summer.
What’s next? “We believe that the confluence of key trends, as highlighted for the second half of 2018, could be supportive of gold demand,” the World Gold Council says.
Gold has fallen to what may well be the lowest levels of 2018. Momentum is beginning to turn. There are major economic developments at play that could drive gold prices sharply higher in the second half of the year. There’s never been a better time to buy gold. What are you waiting for? Give Blanchard a call today.


