


Three Things That Should Scare Some Investors this Halloween
Posted on — Leave a commentAs equities continue to ride high investors are seeking aggressive ways to amplify their earnings. However, beneath the euphoria of today’s bull market are risks that hide in the shadows. Here, we take a look at three things that might give investors the creeps.

BATs and FANGs
No, I’m not talking about Dracula. In recent months investors have flocked to this core of outperforming stocks. BATs consist of Baidu, Alibaba, and Tencent. Each are major players in the Chinese economy and have posted strong gains. Meanwhile, FANGs are more recognizable to U.S. investors. That group includes Facebook, Amazon, Netflix, and Google. Profits have been substantial here also. Lured by performance, many investors fail to notice the high costs of some of these holdings. Consider, for example that today Baidu trades for 44 times earnings. Alibaba is trading at a whopping 59 times earnings and Tencent at 53. Not cheap. These high prices mean each will need to generate major revenue to support the heavy expectations. Facebook, Amazon, Netflix, and Google are all pricey as well at 39, 280, 242 and 37 respectively. These high costs are representative of the stock market as a whole.
Interest Rates are Back from the Dead
Federal Reserve Chairwoman Janet Yellen has made clear her willingness to keep the option open for another rate rise before the year ends. Moreover, three additional rate increases are expected in 2017. What does this mean for exuberant equity investors? It means the surge in stock prices will face pressure in the coming months because as Russell Investments has reported “On average, U.S. equities perform somewhat worse in rising interest rate periods than in falling rate environment.” Even the Wall Street Journal has reported in recent weeks that “The stock rally could stall if the Fed moves to normalize monetary policy faster than expected, investors and analysts say.” Investors should take caution but few are allowing this reality to temper expectations.
The Man in the CAPE
Nobel Laureate Robert Shiller is the man in the CAPE. The specter of his cyclically adjusted price-earnings ratio (CAPE) looms large. This valuation measurement is at a near historic high. In fact, it has only been higher in 1929 and 2000, periods of catastrophic decline in the stock market. “We are at a high level, and it’s concerning,” he remarked in June of this year. This lofty figure has prompted some to warn that valuations are running too high and that a correction is due. Of course no one can (or should) attempt to time the market, however, when a measurement like this is at its second highest level since the late 1800s it’s time to consider how risks are growing.
Is doom around the corner? Likely not. But, investors would be wise to reevaluate their diversification strategy with commodities like precious metals. Gold and silver help spread out risk. Also, the same research cited from Russell Investments above noted that commodities “showed superior returns rising vs falling rate periods.” Sometimes the scariest things are those we don’t see until it’s too late.
5 Must-See Charts for Gold Investors
Posted on — Leave a commentYou’ve surely heard the saying: “A picture is worth 1,000 words.” We found five charts that show why gold is a smart investment for everyone.

Chart 1: Currency in Circulation
The amount of currency in circulation continues to rise and is at an all-time high. This is paper currency, not backed by a hard asset. The printing presses remain in high gear.
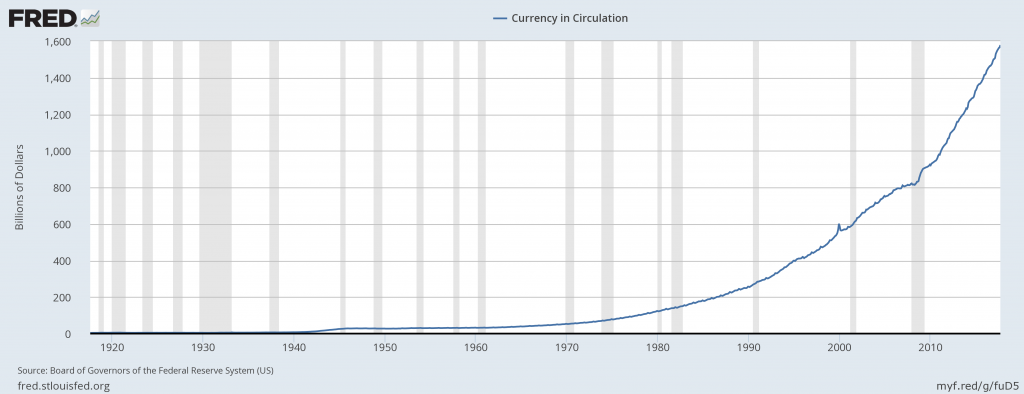
Chart 2: Total U.S. Debt at $20 Trillion
Total U.S. debt continues to rise. The price of big wars, tax cuts and economic stimulus packages have boosted debt levels over the years. Is the problem getting better or worse? Will policymakers ever be able to right the debt ship? If not that leaves Americans vulnerable to higher interest rates and eroded purchasing power with paper money in the years ahead.
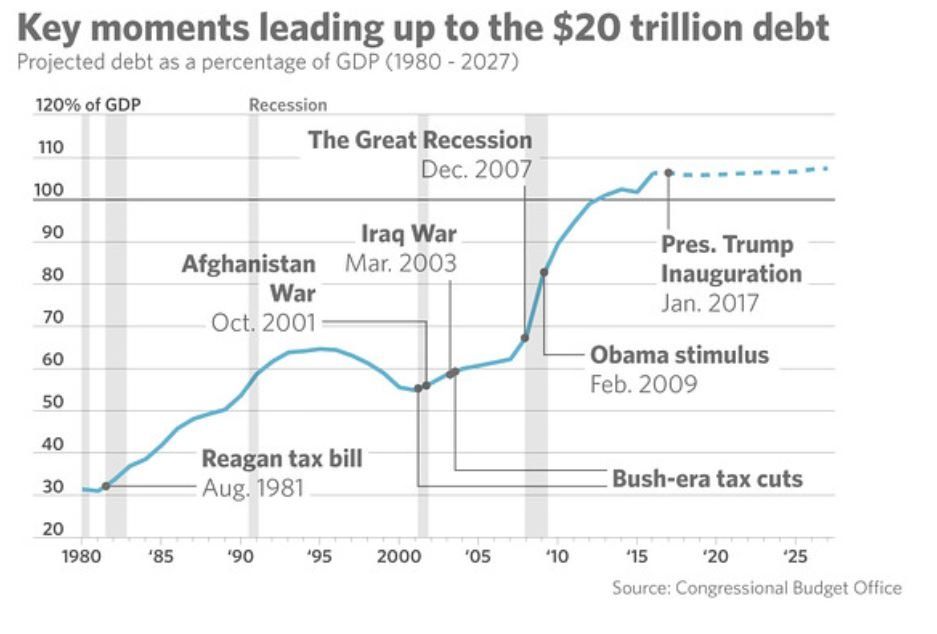
Chart 3: Long-Term CD Rates
You may remember several decades back when CD rates were at double digits. Many retirees used CDs as a safe way to generate income on their savings. Today, you are lucky if you can generate 1.00% on a savings account. There is no return on paper money and your purchasing power with paper money continues to decline (see chart 4).
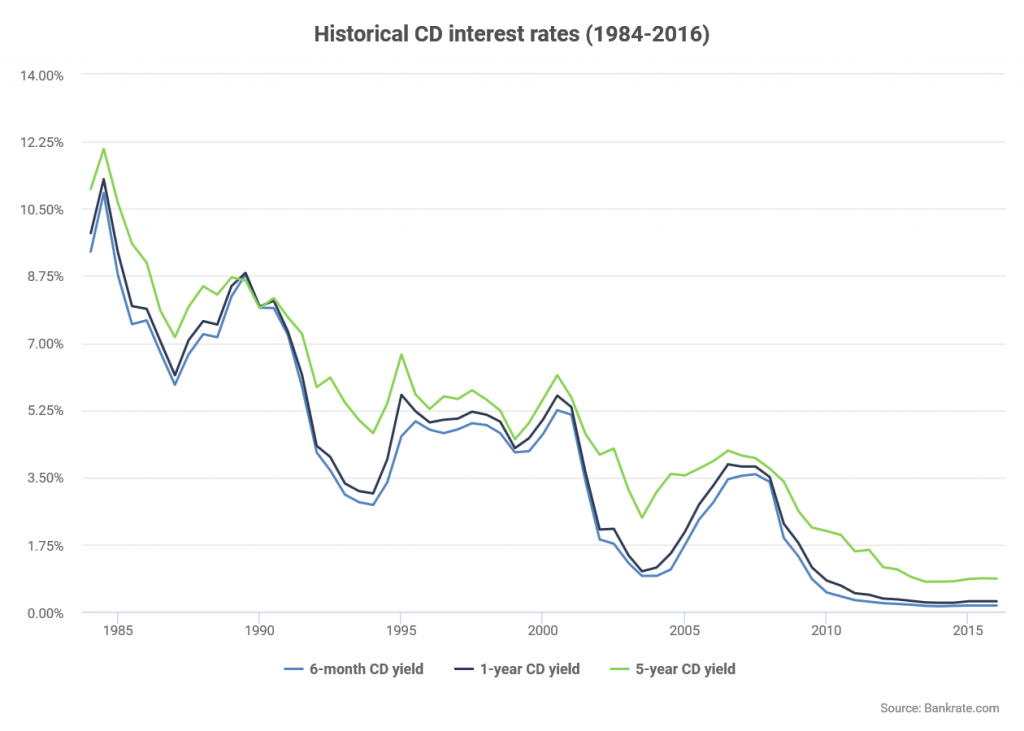
Chart 4: Purchasing Power of the Dollar
The purchasing power of your dollar continues to decline. It’s been a steady erosion since the Great Depression ended. While you may amass more dollars through your income, or capital gains in the stock market, what is that dollar really worth?
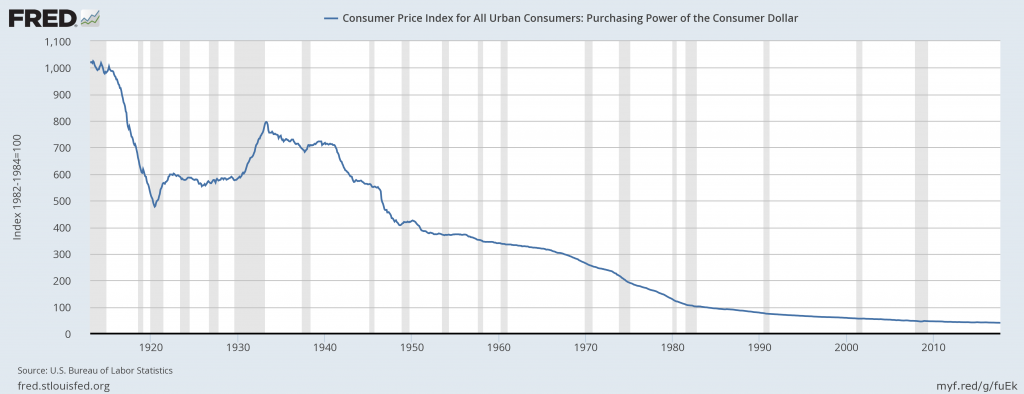
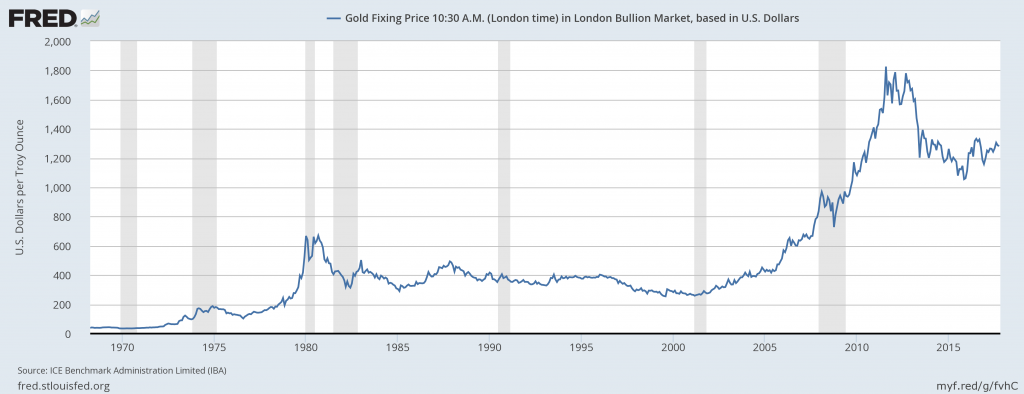
Chart 5: Long-Term Gold Chart
In 1973, an ounce of gold was worth $100. In 2011, an ounce of gold traded over $1,800 an ounce. The long-term trend remains up. Well-known forecasters predict the price of gold will surge as high as $2,000 an ounce by 2020. For investors who are keen on protecting the true value of their assets, gold is a vehicle that preserves and protects your future purchasing power.
Wall Street money managers are now recommending diversification up to 30% in physical gold. How confident are you in your current investment plans? Contact a Blanchard portfolio manager today at 1-800-880-4653 for a confidential, personalized evaluation of your individual financial goals and learn how tangible assets can help you achieve the financial freedom and security you desire.
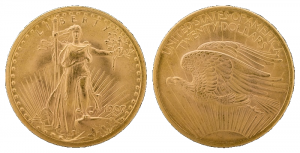
How to Lose $80 Million in Gold Coins
Posted on — Leave a commentSome events are so rare they last only for moments. This was the case for the Langbord family in 2003 when they found $80 million in rare gold coins. One such coin fetched $7.5 million at a Sotheby’s auction in 2002. The family made the discovery after drilling into a safety deposit box that belonged to their deceased father, Israel Switt. Inside were 10 coins, each a 1933 Saint-Gaudens. They are among the rarest coins in history and the Langbord family didn’t hold them for long.
The family took the coins to the Philadelphia mint for authentication. It was the last time they would hold the fortune in their hands. The government promptly seized each coin. “This is a case that raises many novel legal questions, including limits on the government’s power to confiscate property,” remarked the family’s lawyer.
445,500 of these coins were minted in 1933, however, none were officially circulated. The mint received a mandate to melt them all down into gold bars when president Franklin D. Roosevelt ordered banks to abandoned the gold standard. Two coins were intentionally left untouched. Today they both reside in the U.S. National Numismatic Collection. Over the years authorities have learned of 20 coins that somehow escaped melting likely as a result of theft. In time the Secret Service found 19 of them and melted down all but nine. The gold content and rarity are what make this coin so valuable today.
When the Langbords learned that their coins were gone they received no compensation. The reason: it’s believed that Switt had access to various stages of the minting process in the 1930s and was able to obtain the coins illegally. However, the Langbords have argued that it’s possible that the coins were, in fact, obtained legally during a very narrow “window of opportunity.” This argument rests on the fact that the mint first struck the double eagles on March 15th and it wasn’t until April 5th that Roosevelt enacted the executive ban on the coins.
In 2011 a jury determined that the coins are in fact the legal property of the U.S. Government agreeing with the argument from the mint’s attorney who stated “these coins didn’t go out through the front door – they went out the back door.” The ruling resulted in the family filing an appeal, which was struck down by the Eastern District Court of Pennsylvania, citing that “the coins in question were not lawfully removed from the United States Mint.”
The family eventually appealed to the U.S. Supreme Court in April of 2017. However, the court denied to hear the case. It’s likely that the Langbord’s discovery will go down in history as the singles largest find of the ultra-rare double eagle coins. To this day the coins are legendary to collectors because they represent a pivotal moment in the U.S. economy when the nation moved away from gold and into dollars backed only by confidence.
Even if they could turn back the clock to the day of their find it’s unlikely that the Langbords could have done much differently. Selling them would have been illegal resulting in a prison sentence. Keeping them secret wouldn’t offer any financial value. For a few days they were among the richest elite, until they weren’t.
Gold as Wearable Wealth: More Than a Fad in India
Posted on — 1 CommentAmerican women are fond of saying “Diamonds are a girl’s best friend.” Not as well-known are the origins of that saying, which can be traced to a 1947 De Beers mining company advertising campaign.

In the Indian culture, “No gold, no wedding” is a popular saying. That underscores the significance of gold in the fabric of Indian society. Rare is a marriage that takes place without some sort of gold being presented to the bride. Gold coins are common gifts. Even in the poorest family a simple gold nose ring is presented.
In India, families build and save their wealth in the form of physical gold. This is often in the form of extravagant jewelry pieces worn by the women of the family. The finest Indian wedding dresses include thread made of actual gold. These gowns are wrapped away in protective coverings and stored in family homes as a protection against hardship or a “rainy day.”
Indian households control an estimated $600-$800 billion of gold, at 2014 estimates and prices, or four times the amount of gold held in Fort Knox. Given the significant price increase in gold in recent years that number is even higher now.
Owning physical gold in India is a type of “insurance policy.” Women stockpile gold. It begins as gifts from their mothers and extends to gifts from in-laws, her husband.
Facts about India:
- The economy is healthy in India. The IMF forecasts the Indian economy to expand at a 7.2% pace in FY 2017-2018.
- It is the world’s largest democracy.
- It is the second largest country in the world by population, home to over 1.2 billion people.
- India is the world’s second largest gold market. Indians typically buy and hold gold – for generations. Gold is passed down from generation to generation.
What this means to American investors:
The Indian economy continues to develop. As more individuals and families become educated and get well-paying jobs, they will continue to funnel a portion of their assets into saving in gold.
Indian gold demand is a long-standing driver of upward pricing in the metals market. And, it is not going away. Instead, it is expected to continue to grow as Indian citizens are lifted out of poverty and into the middle class. This will mean even more gold demand in the future.
American investors turn to gold for many reasons. A portfolio diversifier, an inflation hedge, a protection against paper money devaluation. Indian investors turn to gold as a cultural wealth building tool. It is deeply ingrained in their culture and gold demand will grow as more Indians have the ability to purchase the metal. More demand means higher prices.
Gold that you are buying now will help preserve and grow your wealth too.
Stay on top of news and trends with the Blanchard eNewsletter
Get the latest tangible assets news, insights and buying recommendations delivered to your inbox every month. Enter your email address at the bottom of this page to subscribe.
What’s Trending Now? Read More:
Since 2017 Started, Your One Dollar Bill Is Now Worth 91 Cents
Follow David Beahm, CEO of Blanchard & Company, on LinkedIn to read his weekly articles on the metals markets, the economy and how investors can thrive in today’s uncertain times
Three Incredible Gold Coin Finds, and One Devastating Loss
Posted on — Leave a comment

- Out for a Stroll
The weather was nice one day in northern California, so a couple took their dog for a walk. They left their house as a regular pair of middle-class Americans. When they returned home, they were multi-millionaires. The woman noticed the edge of a rusted can sticking up from the ground and dug it out to get a closer look. Inside they discovered a hoard of 1,427 gold coins totaling $10 million. Incredibly, the coins were uncirculated and in mint condition dating between 1847 and 1894. They find, so rare, captured the attention of one gold expert who explained, “you don’t get an opportunity to handle this kind of material, a treasure like this, ever.” In fact, some believe this represents the largest single find of gold coins on U.S. property in history. Many of the coins carry $5, $10 and $20 denominations, however, now, so many years later, their worth has skyrocketed.
- Rise and Fall of the Roman Empire
This year a woman, out for a hike in Israel, came across a glimmer in the soil. That little glint was a coin so rare that experts believe there is only one other like it in the world. “The coin was struck by Roman Emperor Trajan in the year 107,” reported NPR. One side shows Augustus, the founder of the Roman empire. On the other side are images symbolizing Roman military legions. The piece was most likely used to pay a soldier. However, such a large, single payment was less desirable to the Romans. Due to its value, it was difficult, at the time, to use the coin for everyday purchases because it was so difficult for merchants to make change. Sadly, the woman was unable to sell the piece. Instead, she was asked to hand it over to The Israel Antiquities Authorities so it could be put on public display.
- Massacre Remains
Sometimes the thrill of a gold find carries surprisingly dark overtones. This was the case when archaeologists made a recent discovery on an island in the Baltic Sea. The location was the site of a mass murder occurring in the 5th century. The coins at the site have led some to theorize that the attack was motivated by a desire for the valuables held by the inhabitants. Atlas Obscura explains that “The face of the coin depicts Western Roman Emperor Valentinian III, who ruled between 425 and 455, with his foot crushing the head of a barbarian.” Others, however, question that the attack was purely for financial gains as many other precious items, like gold rings and bracelets, were also left at the site untouched. Moreover, details of the mutilations seem particularly personal. For example, archaeologists found several skeletons with their mouths stuffed with either goat or sheep teeth.
- The Berlin Heist
Want to get rich? Apparently, all it takes is a ladder and a wheelbarrow. In March of 2017 thieves broke through bulletproof glass at the Bode Museum in Berlin, Germany and stole a single gold coin. Why would burglars face so much risk for just one coin? Because it’s one big coin. It weighs 220 pounds and is 99.999 percent pure gold. It’s worth over $4 million. Police are uncertain how the group was able to evade the alarm. It’s believed that the coin has been melted down into bars to further elude authorities. Recently, four suspects were arrested. However, police have not recovered any gold.
The Five Pillars of the Central Bank Gold Agreement
Posted on — Leave a commentGold is critical on the stage of the global economy. In fact, it’s so important that eleven nations formally agreed that the commodity is a mainstay of sovereign nations. While die hard equity investors often eschew gold as a relic of the past, the fact remains that our world’s economy requires gold as an international reserve. This is the belief underpinning The Washington Agreement on Gold first signed in 1999. It includes five major statements on which countries like England, France, Italy and the U.S. agree.

First, they all agree, that gold will remain an important element of global monetary reserves. This belief is illustrated not just by nations agreeing to the statement, the numbers also support their conviction. As MarketWatch reports, “Around 20% of all the gold ever mined is held by central bank and governments, with the biggest official holdings at the U.S. Treasury with 8,134 tons.” Research from the Official Monetary and Financial Institutions Forum posits that central bank activity surrounding gold can be delineated into “Seven Ages,” the most recent of which started in 2008 in response to the global financial crisis. They explain that since that upheaval “central banks in both developed and developing countries have shown a new fondness for the yellow metal, rebuilding gold’s importance as a bedrock of most countries’ foreign reserves.”
The second component of the agreement asserts that “The above institutions will not enter the market as sellers, with the exception of already decided sales.” This statement helps preserve the longevity of the agreement ensuring that the included countries maintain an equilibrium. Third, the document states that any sales arraigned before the agreement will occur over a period of five years with annual sales not exceeded 400 tons. Fourth, the countries agree that they will refrain from expanding gold leases and gold futures and options over the period of the agreement. This statement is, in effect, an extension of the promise to not enter into the market as sellers.
Finally, the countries agreed to review the agreement after a period of five years. History shows they all held up with end of the bargain and renewed the agreement in 2004, then extended in again in 2009. This is the reason that “Central banks have been net buyers of gold since 2008, and today comprise a significant portion of annual gold demand,” according to the World Gold Council.
What is most striking for investors about this agreement is the powerful message it sends regarding the importance of gold in global markets. It stands to reason that if all of these countries can pledge their commitment to hold reserves of gold then ordinary investors can have faith in the immutable value of the commodity. Case in point: we’ve seen central bank gold holdings increases steadily since 2007 where total holdings were nearly 30,000 tons. By comparison, in Q1 of 2017 that figure is over 33,000 tons. The longevity of the agreement may be rooted in the fact that in times of crisis gold outperforms US Treasuries, Japanese government bonds, German “bunds,” and UK gilts. Here, “crisis” includes events like the 1987 market crash, the Dot-Com bubble, September 11th and the global financial crisis of 2007.
If holding gold for the long-term is good enough for global nations it’s good enough for investors.
3 Things Coin Investors Should Know About the Palladium American Eagle Coin
Posted on — Leave a commentMove on over gold and silver. There’s a new American Eagle coin on the block.
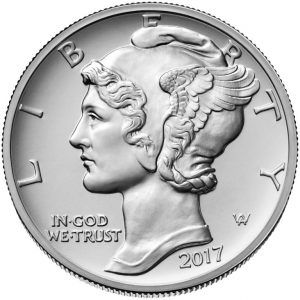
For the first time, the United States Mint began offering a one-ounce American Eagle Palladium bullion coin in late September. The new coin is designed to offer investors an easy and cost-effective way to invest and hold physical palladium.
Those investing in precious metals are well aware of the value and properties around gold, silver and maybe even platinum. But, palladium? What is this under the radar metal?
Here are 3 things you might not have known about palladium:
1. Palladium is a precious metal and industrial metal.
Palladium is used widely in pollution control devices for gasoline powered cars and trucks. That makes the new American Eagle a great diversification tool in the precious metals arena.
2. Palladium is the biggest gainer in the commodity universe in 2017.
The price of palladium surged an incredible 34% (through Oct. 7) since the start of the year. That’s more than double the return of the S&P 500 this year. Palladium demand is forecast to rise to 10.13 million ounces in 2017, surpassing the 10 million ounce mark for the first time since 2014. That means the new one-ounce palladium American Eagle arrived at the right time. There is huge interest in palladium investment.
3. The price of palladium scooted past platinum recently for the first time since 2001.
Last week, spot palladium hit a high at $946.00 an ounce. That compares to $921.00 an ounce for spot platinum. Demand has been rising for palladium, while demand for platinum (jewelry and components for diesel powered vehicles) has slid. See current spot prices here. That means current prices of the new palladium American Eagle coin could be a bit rich.
Investing Moves
Should you snap up this new palladium coin? From a diversification perspective, palladium investment is a smart move. Just as you diversify your equity portfolio from large cap stocks to international stocks, with a few value stocks and dividend stocks thrown in the mix. The broader diversification you have in the physical precious metals arena, the better.
Patience could be a virtue. For coin investors who’d like to add palladium to their portfolio, consider this. Sometimes when a market rallies excessively, it becomes overstretched, overvalued and vulnerable to a snap-back correction. That could be the case now for palladium, according to well-respected metals consultancy CPM Group.
- “Platinum near rock bottom, palladium on the edge of a cliff,” the CPM Group report said.
“Quite often the prices of these metals run ahead of their fundamentals and that could be the case with palladium. If there is a decline in prices the fall could be sharp be-cause of the nearly unilateral fashion in which this market has performed in recent years. There have been a lot of
new investors that have entered this market, attracted by the healthy and sustained rise in prices. . . Many of these investors are likely to leave the palladium market just as quickly as they got into the market,” the report said.
Platinum Buy Spot
In the meantime, current levels may offer one of the best buying opportunities in platinum seen in years.
Platinum is another precious metal that benefits from both industrial demand and investment demand, and also has a long history of being used in coins for currency. Platinum and palladium are widely used in industrial applications including automobile manufacturing. Both of these metals exhibit qualities, such as durability, resistance to corrosion and catalytic properties that make them heavily used in industry.
Learn more the benefits of investing in physical platinum here.
Investors can and should diversify their tangible assets portfolio through diversification across metal types by purchasing of a mix of silver, platinum, palladium, and gold coins and bars. Right now, platinum, may offer an excellent long-term buying opportunity. Platinum bullion U.S. Eagles, produced by the U.S. Mint, are minted in a variety of denominations.
Contact Blanchard today at 1-800-880-4653 and a portfolio manager can identify investments that are the best fit for you.
5 Ultra Valuable Coins: Collectors Benefit from Mint-Made Errors
Posted on — 10 CommentsIf you make an error at your job, you may get a gentle reminder or a stern reprimand. But, rarely does the error make your final product more valuable.
Not so, if you are in the coin minting business.
In fact mint error coins and misstrikes typically hold a higher value than a coin in its intended condition. Some of the rarest error coins are worth $75,000 or even more.
Collectors value error coins according to their scarcity, and price is determined by supply and demand. The fewer mis-strike or mistake coins that were minted, the more valuable those coins are today. Are you wondering what these valuable rare coins are? Before we dive in, let’s define some terms first.
Types of Coin Errors & Mistakes
A double strike coin is one that shows a second image. That occurred when a coin was struck a second time off center. These minting errors occur when a struck coin goes back into the press and is struck a second or even third time. The more times a coin was struck the higher the potential value.
A planchet is a blank disc of metal, which could be steel, silver, gold or more, which is created for coinage.
An off center coin is one that was incorrectly centered and part of the design is missing. These errors occurred when the planchet was not inserted into the press correctly.
A wrong planchet coin was created when a coin was struck on a planchet meant for another denomination or the wrong type of metal.
A defective die coin reveals raised metal from a crack in the die.
5 U.S. Mint-Made Coin Errors that Are Now Ultra Valuable
1. The 1943 Lincoln cent struck over a struck 1943 Mercury dime.
2. The 1909 Indian Head cent struck on a stuck 1906 Barber dime.
3. 1976- D Washington quarter. This double strike is notable due to “off-center” strikes on both sides of the coin.
4. 1923 Peace dollar. This double strike formed when the coin was struck about 45% off center, but then re-positioned and struck a second time.
5. 1977 Jefferson nickel struck on a 1976 Lincoln cent. This is a “double denomination” error (nickel and penny) and both dates are visible on the coin.
These error coins are valued from a few thousand dollars to $75,000 or more.
Plugging up the Error Coin Supply
Errors of many kinds are evident on U.S. coins since minting began. However, a new production process started in 2002 which nearly eliminated these coins from going into circulation. A new delivery system was put in place for coins. Coins directly go through automated counters which filter out imperfect coins. Very few mint-made error coins have hit the market since 2002. The static supply of error coins increases the value of these early error coins even more.
If you are in search of a specific coin, let us know. Blanchard and Company has tremendous reach and respect within the rare coin industry. If there is a particular coin or set that you are trying to build, our numismatists can help source your coins from collections around the world.
Do you have any error coins? Or, is there a coin that you’d love to have in your collection? Tell us about it!
Avoiding the Technopoly of Trendy Investments
Posted on — 1 CommentToday, more than ever before, we value technology. The more advanced and sophisticated a piece of technology is, the more we respect it. In his book Technopoly: The Surrender of Culture to Technology, author Neil Postman writes that we live in “a peek-a-boo world, where now this event, now that, pops into view for a moment, then vanishes again. It is an improbable world.” He continues that “it is only now beginning to be understood that cultures may also suffer grievously from information glut, information without meaning.” Though penned a quarter-century ago, these worlds hold particular relevance today as people navigate an ever-expanding labyrinth of investment products like cryptocurrency, ETFs and other digital offerings. His ideas prompt new questions for today’s investor; Does the novelty of an investment’s technology drive real or perceived value?

Many investors pursue outsized gains by seeking early investment trends. As a result, many investment products leverage their unique technological characteristics to position themselves as an emerging trend. When these products market themselves as bold, new alternative investments, people become transfixed by the notion that they’re standing at the doorway of “the next big thing.” In reality, however, the value will ultimately be determined by the underlying methodologies which are often as hollow as the investor’s misplaced value in the technology.
A study of fund returns and total net assets of more than 7,000 mutual funds from 1993 to 2014 illustrates the faultiness of placing value on the technological underpinnings of trendy investments. Researchers Jason Greene and Jeffrey Stark separated the collection of funds by sifting out those that included trendy terms. What did they find? As one journalist explained, “As you might expect, they found that mutual fund families attempt to attract assets by launching ‘trendy’ funds.” The biggest problem, however, is the performance.
The “trendy” funds “under-perform over their first five years compared to non-trendy funds, with the trendiest startup funds underperforming the least trendy startup funds by an average of 1.03 percent per year on a risk-adjusted basis.” Adding to this problem are larger fees (expense ratios). The “trendy” funds had a fees that were, approximately 0.20 percent higher than their non-trendy counterparts on average.
Meanwhile, investments like gold bullion, have enjoyed regular price appreciation over the decades because they exemplify the timelessness of an asset that doesn’t need to leverage an emerging technology as a selling feature. Rater, gold, in all its simplicity, is in stark contrast to tech-heavy products like P2P funds, cryptocurrencies, and smart beta ETFs. Demand for gold is not subject to the whims of technology or fads that inevitably fade. Instead, gold is a global currency that has roots which run deeper than the hot trend.
It’s ironic that the trendiness which propels an investment product is also often the agent of its demise. The reason for this dynamic is simple: a new, flashier trend takes the place of the last one. This phenomenon is in keeping with Postman’s assertion that unquestioned trust in technology serves “to make people believe that technological innovation is synonymous with human progress.” Question the trend.
2 Reasons All this Debt Is So Scary
Posted on — 2 Comments
Americans rack up highest debt levels in history
Debt levels are rising. Not only at the government level, but the personal level too.
American consumers recently hit an alarming milestone.
Even though the economy is growing, the labor market is supposedly strong, cash-strapped Americans are taking on more debt than ever.
- Americans now have $1.021 trillion in outstanding revolving credit debt (mostly credit cards), according to the latest report by the Federal Reserve.
That is the largest amount of debt in history.
Meanwhile, the U.S. government sailed past the $20 trillion mark with our federal debt. Right now, policymakers in Washington D.C. are busy proposing legislation that would remove the debt ceiling limit for Congress.
In essence, that would give Congress an ultimate blank check, or a credit card with no credit limit.
Why all this debt is so scary
- This debt is slowing us down
- Higher interest rates will eventually mean the U.S. government must spend more on interest payments and less on services for its citizens
Even if Americans or the government never pay off their debt, they still have to pay the interest on that debt each month.
Are You Prepared For Tomorrow’s Debt Problem?
Even though the Federal Reserve has edged interest rates slightly higher over the past couple of years, they are still very low. Low rates benefit anyone who is paying off debt. But, once interest rates go higher, that means interest on your debt goes higher too.
Why does this matter? At some points interest rates will go up, and perhaps significantly.
Higher rates mean a larger portion of the government’s outlays must go toward debt repayment. That means less for the Social Security and Medicare payments, military, roads, education, and whatever other services the government spends money on.
How low is low?
- Right now, the federal funds rates stands at 1.00-1.25%
- That compares to a “normal” rate of around 4%.
Looking at the U.S. 10-year Treasury yield (the rate most mortgages are based off), before the 2008 global financial crisis, yields were much higher.
- Right now: U.S. Treasury yields 2.26%
- In June 2007, the 10-year yield stood at 5.31%.
- In January 2000, the 10-year yield stood at 6.82%.
- In July 1996, 10-year yields registered a 7.09% reading
- In November 1994 a high was seen at 8.16%.
Debt to GDP ratio
Once government debt levels climb above 90% —that, in and of itself, weighs on economic growth prospects, according to Carmen Reinhart, a professor at Harvard Kennedy School and Kenneth Rogoff, an economist at Harvard University.
The U.S. has already blown past that mark. Debt to GDP ratio stands at 103.1 as of the second quarter, according to the St. Louis Fed.
The U.S. (and other major advanced economies) are already struggling with slow growth for a multitude of reasons. The debt only compounds the problem.
What this means for you
Gold can’t be devalued like paper currency. The Fed can’t “print” more gold any time it’s looking to juice up the economy. Gold is a true, time-honored store of value recognized in every country around the world. There’s many reasons to own gold, and high and rising debt levels may just be another one.
What do you think about the debt problem? We’d like to hear your thoughts.


