


The New Global Gold Rush
Posted on — Leave a commentIn a recent post we explored how, despite conventional wisdom, the primary driver of gold’s price is supply and demand. Today, we’re seeing how this imbalance is forcing more aggressive mining operations. As investors continue to buy more gold, sending prices higher, mining companies are seeking more ways to source the precious metal. They’re digging deeper. Is some cases they’re digging into the ocean floor.

In an effort to boost resources Beijing is leveraging their state-owned shipyards and vessels to explore gold deposits beneath the ocean floor. This novel approach is possible due to recent innovations in mining. By widening the radius of their exploratory efforts, the country hopes to become a dominant gold metal supplier.
This push for more gold comes not just from its inherent value but from the ever-expanding technological industry. China is responsible for 95% of the metals used in all electronics products. Moreover, the World Gold Council reported that “Technology demand registered its third consecutive quarter of growth: up 2% to 81.3t. Growth in wireless charging and development of features that use LEDs boosted demand. New smartphone handsets supported chip production. “
Interestingly, efforts to move towards greener, more sustainable energy sources has done little to abate China’s resolve to dig. Rare earth metals, like gold, represent critical components in wind turbines and solar panels. One engineer from SMD, a deep sea vehicle manufacturer remarked that “China has more mining exploration areas in international waters than any other country — in line with its higher mineral demand.”
Meanwhile, in the U.S. equally intense efforts are underway to expand gold mining. Recently, Newcastle Gold Ltd has made a brazen move to widen their footprint. Originally, the operation was set to pull 10 million tons of ore from an area of land covering 8,300 acres. However, today, they’re pushing to expand this sizable effort with a bold request for expansion from the U.S. government. This development represents just one more link in a chain of miners seeking ways to satiate surging demand.
The Guardian recently reported that Romania’s prime minister has made moves to help miners in the area access “an estimated 314 tons of gold as well as 1,500 tons of silver,” which represents Europe’s largest known gold deposit. Mining company Gabriel Resources earned an exploration license in the late 1990s and continues to pursue opportunities in the region.
The resolve of miners across the globe to travel further, dig deeper and explore underscore just how healthy demand remains amid waning supply. In fact, appetites have risen so far that some countries, like France have had to take measures to squelch illegal mining. The country has dispatched armed forces in French Guiana where illegal operations have been in place for decades.
In aggregate, these measures have yielded increasing production in recent years. However, in time these resources will become scant and the infrastructure necessary to find them will become more intense. Gold investors stand to gain in such a climate.
Stocks and Gold Have Best Week of 2017
Posted on — Leave a commentStocks in the US closed out the final week of August with a bang. Major stock indices rose the most on a weekly basis for all of 2017 amid signs of a strengthening economy and favorable economic data.

Although stocks initially sold off on Tuesday of last week, markets quickly rebounded on an intraday basis and managed to close positive for the entire week.
The Nasdaq Composite Index had its best weekly rise of the whole year as it finished with a weekly gain of 2.7%. Most of the Nasdaq’s gains came from the biotech sector. The Nasdaq Biotechnology Index finished the week nearly 8% higher following groundbreaking FDA approvals and bullish industry merger news involving one of the largest biotech companies, Gilead Sciences (GLD).
Following in the footsteps of the Nasdaq, the S&P 500 closed the week with a nice gain of 1.4%. The Dow Jones Industrial Average, however, trailed behind with a weekly gain of 0.8%.
Many analysts were impressed yet equally cautious with last week’s gains because of the extremely low liquidity ahead of Labor Day weekend.
“It’s hard to draw any real conclusions on the activity in the market this week because volumes are just so low,” said Art Hogan, chief market strategist at Wunderlich. He went on to note how “you could basically see volume decrease by the hour,” when referring to last week’s gains coupled unusually light trading volume.
Since economic data was the primary focus of last week’s market moves, gains weren’t just limited to stocks.
Although the hiring pace slowed and the unemployment rate rose slightly, job wages rose less than expected. According to the Labor Department, hourly average earnings ticked up just 0.1% from the prior month. Market participants were expecting a wage increase of 0.2%.
Slower than expected wage growth is particularly bullish for stocks, but it’s also bullish for precious metals. This is primarily due to the fact that wages are still rising at what seems to be a perfect rate.
Continued wage growth will likely cause more consumer spending, which is a direct boon to the economy, but this level of low wage growth may alter the Federal Reserve’s rate-hike agenda.
“It’s right now in the sweet spot where it’s enough to drive consumption but not enough to lead inflation jumping up so the Fed feels it needs to be more aggressive. It’s also not affecting profit margins yet,” said Sameer Samana a global quantitative analysts at Wells Fargo Investment Institute.
Lingering nuclear drama from North Korea and a plausible delayed rate-hike path was enough to send gold for September delivery soaring 2.5% for the week; it’s largest weekly rise in well over a year. September gold futures traded as high as $1,334.5 per ounce on Friday before closing at $1,329.90 to make a new YTD high.
Besides the perfect amount of wage growth, other economic data also points to a likely delayed rate hike. August’s job creation of 156,000 with an unemployment rate of 4.4% is leading many analysts to speculate that the Fed might actually hold off on rising rates another time in 2017.
The current consensus is that the Fed will hike rates one more time in 2017. However, if this doesn’t happen due to economic data that has the perfect balance of helping the overall economy but causing the Fed to hold off on interest hikes, it will likely be a direct boon to both stocks and everybody’s favorite precious metal – gold.
Revisiting the Three Gears of the Gold Machine
Posted on — Leave a commentGold recently reached its highest finish in 11 months after topping the $1,300 per ounce mark. These strong and consistent movements have reiterated to many the role of gold as an economic weathervane. “I would say it’s the low-yield environment, the trend of the dollar and strong growth in emerging markets [that are driving gold],” remarked the founder of Exante Data.

However, how certain can we be that these three popular “influencing” gears drive gold prices today?
Some have cited gold’s rise as a response to recent interest rate movements. However, history tells a different story. In fact, research has shown that from 1970 to 2015 the correlation between interest rates and gold prices is a scant 28%. Despite these figure, the myth of a long-standing inverse relationship between yields and bullion remains strong. Some attempt to assert an inverse relationship with a look back to gold prices in the 2000s because bullion prices increased as interest rates dropped. However, the confluence of these events has never been shown to be sustained. Moreover, they rarely occur in lockstep with one another.
Meanwhile, many believe the changing value of the US dollar is influencing gold’s price. While there may be a tenuous connection it is often overstated. In fact, there is reason to believe that the US dollar today exacts less influence than ever before. Part of this waning relationship is due to the diminishing role of the dollar as a world currency. This comes amid movements from central banks to purchase gold as a reserve currency instead of dollars. “Beware of simple maxims. Even as we look at the interplay of factors that affect gold, it is hard to ignore the voices of those who insist that the US-dollar is gold’s main and only driver,” explained the World Gold Council.
In reality, the relationship is more nuanced. “We generally see an inverse relationship between the gold and the dollar, but our analysis shows that this relationship is asymmetrical. Gold prices increase more when then dollar weakens than they fall when the dollar strengthens – and sometimes, gold and the dollar move in the same direction.” A simple rule of thumb doesn’t apply. In fact, a lessening reliance on the US dollar offers clues to what’s really influencing prices.
“One reason for gold’s renaissance as a monetary asset has been developing countries’ hesitancy about relying unduly on reserve holdings in dollars. China, in particular, seems to be following a strategy of using gold to counter the weight of the dollar,” explains The Financial Times. As emerging markets opt for bullion, rather than the dollar, gold is seeing demand push prices up.
The same article explains that central banks have added over 2,800 tons of gold since 2008. Today that figure is almost certainly even higher. All the action is in emerging markets. Meanwhile, developed countries are merely maintain their reserves. This dynamic illustrates the simple, more influential aspect: supply and demand. Rather than look to the dollar or fluctuations in interest rates investors need only consider supply levels and reinvigorated mandates from emerging countries to boost their gold reserves.
Markets Struggle to Find a Direction
Posted on — Leave a commentAfter an ominous sell-off on Monday of last week, markets in the US mostly recovered from two consecutive weeks of losses. S&P 500 futures made a three-week low of $2,215.75 on Monday morning, and market participants were evidently waiting to buy the dip.

After all three major benchmark indices made their respective low points on Monday, prices immediately started climbing again. The rally carried into Tuesday, where the Dow Jones Industrial Average had its best one-day rally in months. The Dow, Nasdaq, and S&P 500 all closed with more than a 1% gain. This rally gave stocks the boost they needed to snap a two-week losing streak.
Despite the very strong gains in stocks, there were also several sharp sell-offs last week that caught investors off guard. And although stocks finished largely higher for the week, the significant sell-offs that came after the sharp rallies resulted in a lack of clear direction and an overall mixed trend in the markets.
Volume on the on the New York Stock Exchange and Nasdaq fell to the lowest level of 2017 on Wednesday. Analysts attributed the lower than usual volume to the lack of economic events and the end of summer. The lower than usual volume provides a possible explanation for the gyrating market moves last week.
“Most people are away, so moves tend to be amplified for no good reason. Technical analysts may point to the 50-day moving average of the S&P 500, which the index keeps failing to break through,” said Michael Antonello, an equity sales trader at Robert W. Baird & Co.
Despite the lack of economic reports last week, the were a few speeches and key events that influenced the markets. The annual central bank symposium in Jackson Hole caused a somewhat mixed reaction. Most of the gains that came immediately after Federal Reserve Chair Janet Yellen’s speech at Jackson Hole, which was supposed to outline monetary policy.
However, Yellen refrained from talking bout fiscal policy and the economy and instead focused on the substantial progress towards full employment and improved banking regulations. With a lack of additional bullish drivers, stocks pulled back shortly after Yellen’s vague comments.
Yellen was not the only Federal Reserve member to influence the markets last week. Remarks from Dallas Fed President Robert Kaplan regarding the effect a stock market correction would have on the economy instigated a huge spike in safe haven assets.
Gold rapidly spiked to $1301.40 per ounce before declining to $1,282.30 and then recovering just below the $1,300 level.
Although nobody truly knows if a stock market correction is looming around the corner, the mere mention of a market correction by a Fed President was enough to cause gold to surge.
Since 1975, Blanchard has successfully helped 450,000+ clients invest wisely in precious metals and rare coins. Our team of experts are always here to help you make the right investment decisions and capitalize on opportunities in the precious metals market.
Call us today at 800-880-4653
Has The Stock Market Correction Begun? What You Need to Do Now
Posted on — Leave a commentStock market volatility screamed higher last week as the CBOE Volatility Index (popularly known as the Fear Index) soared over 30% in just one day.

Political turmoil in Washington D.C., combined with a lack of any substantial policy achievements are taking a toll on the stock market.
After all, a large part of the optimism that drove the stock market sharply higher in the months after the November 2016 U.S. presidential election were expectations that the new White House, combined with the Republican Congress would be able to push through significant economic-stimulating legislation.
Let’s look at what’s happened so far in Congress:
- Health care legislation has stalled.
- A major infrastructure spending bill is on the back-burner.
- Tax reform remains a possibility, but likely at a lower scale than previously expected.
Q: What does this mean for investors?
A: Brace for a correction
The Stock Tide Is Turning: It’s Official
The stock market took it on the chin last week. The S&P 500 closed lower on the week and fell below its early August swing low. In technical trading terms – the sell-off broke the daily uptrend pattern. A new minor downtrend is evolving on the daily chart and it is only a matter of time before investors know how deep the correction will become.
Bear Market Basics
When stocks are going up, it is all too easy to forget about the down market cycles.
- A Pullback = 5-10% decline in the stock market
- A Correction = 10-20% decline in the stock market
- A Bear Market = 20%+ decline in the stock market
Here are some important historical points or “bear market basics” from Sam Stovall, chief investment strategist at CFRA.
In the stock market, since WWII, there have been:
- 56 Pullbacks
- 21 Corrections
- 12 Bear Markets
Recent History
A 50% decline in the U.S. stock market occurred from 2000-2002 and again in 2007-2009.
Is Your Portfolio Prepared?
Gold has historically performed the best, when the stock market cycle is at its worst.
The average gold return hit 14.2%, when the S&P 500 fell 20% or more – going back to 1968, according to a recent Wells Fargo Investment Institute report.
Now Is the Time to Act
Gold prices are already rising. If you are looking for a way to hedge your portfolio against a stock market correction or even worse, historically gold rises when equities fall.
Call Blanchard today at 1-800-880-4653 to speak with a portfolio manager about personalized recommendations that make sense for you and your financial future.
Can Blockchain and Gold Coexist?
Posted on — Leave a comment“Blockchain” technology, a form of digital record-keeping, has increasingly become the answer to all the woes of the financial industry. Amid accounting scandals and unethical behavior in banking and trading, more people have turned to this public, distributed ledger. The basis of much of its appeal is the secured cryptography which forms the backbone of the system.

Recently, the Senior Vice President at Fidelity Labs remarked “blockchain technology will change the world.” Why does he believe this modern marvel holds such potential? “The big story is you can transfer value through software and software alone. This is a huge societal breakthrough,” he remarked. Bitcoin has become the most popular incarnation of this technology. However, can the modernity of blockchain be translated to the tradition of gold?
The CME Group, based in Chicago and Britain’s Royal Mint believes they can marry the two. Recently, they started to test blockchain as a capability for trading gold. The initial testing has occurred with a few unnamed major financial institutions. If successful, the system is scheduled for a full launch before the year ends. Each unit represents a digital holding of 1 gram of gold held in a vault.
Why is blockchain technology considered safe? The answer lies in its shared existence. That is, the system is decentralized, existing across a network of computers. Therefore, it’s not possible for one person to retroactively alter a transaction without simultaneously altering all preceding transactions which would precipitate the collapse of the system. Simply put, blockchain exists everywhere at once. Attempt to change something and everyone will know. Think of it as a digital hive.
“There is a higher level of traceability and audit that comes with blockchain technology because participants are provided with a permanent, immutable record of ownership and chain of ownership and custody,” remarked the chief operating officer associated with the gold blockchain project. While the promise of blockchain technology is encouraging many caution that we’re in the earliest years of its development.
In an interview Don Tapscott, the co-founder of the Blockchain Research Institute, explains that we still have progress to make with respect to the reinforcing structure of the technology. He warns that “This new community is in its infancy. Unlike the Internet, which has a sophisticated governance ecosystem, the whole world of blockchain and digital currencies is the Wild West.” Interestingly, one problem on the horizon, he posits, is that the popularity of the technology could be its own undoing. Block sizes will need to increase to accommodate a growing number of transactions.
For now, it seems blockchain technology and gold aren’t the perfect pair. While an evolved version of the tech might change this assertion it appears that today gold is still gold. Moreover, physical gold investors have a long way to go before being convinced that a portion of digital coding will instill the same confidence as bullion in a safe. Much like ETFs blockchain gold ownership undermines one of the most appealing aspects of the investment, its tangibility.
Why the Stock Market is Falling Again
Posted on — Leave a commentMarking only the fourth occurrence this year, the S&P 500 index closed negative for the second week in a row amid mounting political worries and a devastating terror attack in Barcelona.

From Japan to the United States, markets across the world sold off in unison on Thursday of last week. In addition to the S&P 500 trading broadly lower, the Dow Jones Industrial Average and Nasdaq 100 index both had their worst one-day dive in three months.
The S&P 500 was off more than 1.50% during Thursday’s trading, while the Nasdaq was down more than 1.90% and the Dow Jones was down 1.20%, respectively.
Analysts attributed Thursday’s stark losses to the combination of the Barcelona terrorist attack and unsettling rumors that, Gary Cohn, the director of the National Economic Council appointed by Trump was mulling resignation.
“In a week where we started by worrying about nuclear war, markets have quickly moved on from this, with yesterday’s weak session more of a response to fears that Mr. Trump’s strategy for the economy and business is falling apart,” said analysts at Deutsche Bank.
Many market participants believe Gary Cohn plays an integral role in much of Trump’s economic plan and view him as a direct boon to the stock market. Having been the president of Goldman Sachs, one of the largest and most prominent investment banks in the world, investors see Cohn as someone who understands the markets and is willing and able to set favorable policies for investors.
Although the White House refuted claims Cohn is planning to resign, pundits on Wall Street were already speculating how devastating it would be if he left his position.
“I don’t want to be an alarmist, but there is a lot of faith that he is going to help carry through the tax reform that people are looking for,” said Jeffrey Sonnenfeld, the Senior Associate Dean of Yale.
“I think if he steps away, it would crash the markets,” Sonnenfeld said. Regardless if Cohn plans on terminating his employment, just a vague rumor was enough to send markets into a free-fall last week.
Evidently, markets are thinly-traded and notably weak in the summer months, especially in August. Moreover, one stock market indicator is sending a flashing warning sign that an ominous sell-off might be lurking around the corner.
Something known as the Hindenburg Omen, which got its name from the infamous fiery blimp crash some 80 years ago, has just surfaced in the markets with a pattern not seen since 2007.
Even though the S&P 500 gained on Wednesday of last week, there were more stocks hitting 52-week lows than 52-week highs. On it’s own, this is not of major concern. However, as of Friday of last week, the Hindenburg Omen occurred during five of the last six trading sessions.
The last time there were more stocks touching 52-week lows than 52-week highs for five days in a row, even with a rising broader market, was in November of 2007. Stocks went on to fall 1.60% the following week and ultimately ended up about 40% lower a year later as one of the worst global financial crises in history ensued.
Out of all of the technical analysis patterns and signals, analysts seem to take the Hindenburg Omen rather seriously because it has a demonstrable history of portending stock market crashes.
Having said that, the only thing that is certain in the markets is uncertainty. And as uncertainty unequivocally rose last week amid the Gary Cohn resignation rumors and the horrific Barcelona attack, investors once again flocked to the safety of gold.
Gold reached a new year-to-date high on Thursday as it finally traded above the critical point of $1,300 per ounce. Gold futures for September delivery traded as high as $1,306.90 per troy ounce during Friday’s trading before the rally slightly fizzled and prices hovered in the $1,295 range.
Gold is always appealing in times of grave uncertainty, and with the possibility of Trump’s Senior Economic Advisor outright quitting, it’s safe to say markets are not at ease.
Since 1975, Blanchard has successfully helped 450,000+ clients invest wisely in precious metals and rare coins. Our team of experts are always here to help you make the right investment decisions and capitalize on opportunities in the precious metals market.
Call us today at 800-880-4653
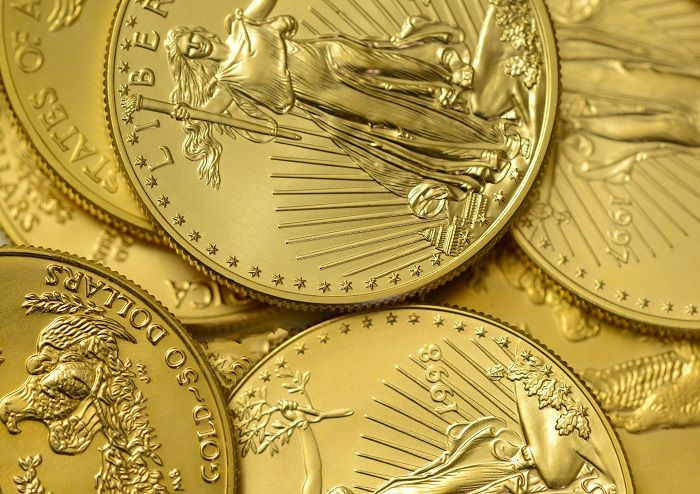
Do You Own These Coins? A Model Rare Coin Portfolio
Posted on — Leave a commentDo You Own These Coins? A Model Rare Coin Portfolio
As Bernard Baruch famously said around the turn of the 20th century: “Nobody ever lost money taking a profit.”
If you are like most investors, you probably have the majority of your assets invested in the stock market. The equity market has been riding high for several years now and your investment returns likely show impressive profits. Congratulations. Now, it’s time to listen to Mr. Baruch and take some profits on a portion of that massive equity run-up.
The tide is turning and cracks are emerging in the stock market bull cycle. Many Blanchard clients are cashing out a portion of those equity profits and shifting those profits into tangible assets including the rare coin market.
Rare coin values are on fire right now. Since mid-June, the $20 Saint Gaudens No Motto MS64 Certified surged an impressive 8.75% jump from mid-June.
History has shown that diversifying 30 to 40% of your tangible assets allocation to rare coins has produced the highest long-term investment returns. Rare coins show a faster and more significant price appreciation when gold bullion is rising, due to the rarity factor.
Are you interested in rare coins, but not sure how to get started? Or maybe you already have an investment in numismatics. No matter whether you are just getting started or a seasoned expert, it is always smart to consider the components of your investing strategy.
5 Major Coin Categories
There are five major coin categories:
- S. Gold Coins
- Morgan and Peace Silver Dollars
- Commeratives
- 19th Century Type Coins
- 20th Century Type Coins
Here are ideas for a Model Rare Coin Portfolio, focusing on U.S. gold coins. These sets can be used as a starting point. Your Blanchard portfolio manager can personalize a plan specifically for you, based on your financial goals and risk tolerance.
Build Sets to Create Greater Value for Your Rare Coin Portfolio
Six Piece Set
Consider investing in a 6-piece Double Eagle set which includes two of the most recognized and collected gold coin types ever struck — the Liberty and Saint-Gaudens:
1. Liberty Double Eagle Type I “Twenty D”
Minted: 1849–1866
2. Liberty Double Eagle Type II “With Motto”
Minted: 1866–1876
3. Liberty Double Eagle Type III “Twenty Dollars”
Minted: 1877–1907
4. High Relief Saint-Gaudens Double Eagle
Minted: 1907
5. Saint-Gaudens Double Eagle “No Motto”
Minted: 1907–1908
6. Saint-Gaudens Double Eagle “With Motto”
Minted: 1908–1933
14 Piece Set
If you already own these magnificent coins, set your sights even higher. Read about a 14-piece set here.
34 Piece Set
Beyond there, aim for the 34-piece gold set. This incredible collection contains all gold coins from the U.S. Mint that were intended for commerce and put into circulation. A complete sample of America’s coin history, the 34-piece set showcases how the coins evolved from 1795 to 1933.
Gold prices are rising and stock prices are falling. There’s never been a better time to take profits in stocks (to make sure you don’t lose money, like Mr. Baruch said). Investing those equity profits can keep your assets growing as volatility and cycle turns begin to impact the broader stock market.
War Chest: How Gold Performs in Times of Conflict
Posted on — Leave a commentAmid recent exchanges between Trump and North Korea, many Americans feel that they’re on uncertain ground. Moreover, the stability of that ground becomes more tenuous with each passing day as the rhetoric climbs. Escalating remarks are prompting investors to question assumptions about their long-term investments. Can history offer any clues to understanding how gold performs during war?

Though today’s threats of war involve the U.S. we can infer wartime price movements based on other international conflicts. Why? Because gold is an international currency and therefore responds to major upheavals across the globe.
A volatile period in the late 1970s brought many serious conflicts. In 1978, we saw the Iranian Revolution. Then, 1979 brought the Soviet Union’s invasion of Afghanistan and the Iran-Iraq war. During this same period gold rose 23% in 1977, then 37% in 1978. However, the real ascent came at the end of the 70s when gold shot up 123%.
Fast forward to 1990. Iraq invades Kuwait, the Gulf War starts and gold increases. Though as the conflict drew to a close gold returned to its pre-war levels. This pattern resurfaced shortly after the September 11th, 2001 terrorist attacks when gold increased again.
Interestingly, history shows that perceptions of war are as influential to gold prices as war itself. That is, when investors believe that a war will be short-lived gold responds with a downward movement despite lack of a peace agreement. This is intuitive as many people view gold as a safe haven asset which serves to preserve wealth in times of geopolitical conflict. For example some analysts have noted that as rumors of war grew amid U.S.-Iran tensions in November of 2007 gold surged to a then 27-year high.
Interestingly, gold can become a weapon, of sorts, during war. In 2012 Syria was forced to sell a portion of their 25.8-ton gold cache to buoy their efforts in the wake of heavy sanctions from Western and Arab nations. Occurrences like this are hardly isolated. Prolonged periods of war can hasten the evolution world finances as was the case when England and France dueled for nearly three decades spanning 1688 and 1756.
Chris Blackhurst, writing for The Independent explains “this led to the Financial Revolution, and the creation of The Bank of England in 1694.” The intention behind the bank was to raise desperately needed money for the government. In his review of Kwai Kwarteng’s book War and Gold: A Five-Hundred-Year History of Empires, Adventures and Debt, he explains “So began a curiously symbiotic relationship – of war and finance, both needing each other. Always, in uncertain times, there was gold itself to fall back upon. To the current period, and there are those who will maintain that our policy in the Middle East resembles those conquistadors.”
In uncertain times investors are wise to revisit their diversification plans. The road ahead is uncertain. Rather than attempt to predict outcomes it’s important to ensure that one’s portfolio is positioned for all eventualities.
Why Gold? Because Diversifiable Risk is Going Away.
Posted on — Leave a commentThe diversification game used to be a whole lot easier. Investors only had to choose a few stocks. Exposure to a few sectors across a dozen holdings was enough to be properly diversified. Today, the picture is different. The world is smaller.

Thomas Friedman, author of The World is Flat illustrated this phenomenon explaining, “In Globalization 1.0, which began around 1492, the world went from size large to size medium. In Globalization 2.0, the era that introduced us to multinational companies, it went from size medium to size small. And then around 2000 came Globalization 3.0, in which the world went from being small to tiny.” This concept is the reason diversification is becoming more difficult to achieve. As the world shrinks the interconnectedness of our industries increases. What impacts one, impacts another.
Many of the largest corporations in the U.S. have turned to emerging markets abroad for growth opportunities. This is a symbiotic relationship as these emerging markets depend on U.S. demand in their manufacturing arena. Data from Charles Schwab shows that equity correlations have been rising since 1995. This trend has prompted savvy investors to abandon the long-held notion that stocks, bonds and cash are the only tools available to the diversified investor.
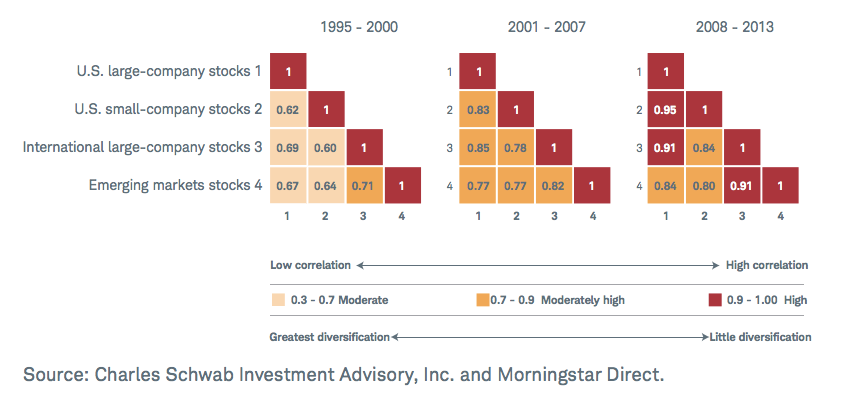
Today, investors are learning that they can become diversified by expanding into international holdings, real estate and commodities like gold. The same body of research from Schwab explains that “commodities tend to perform differently in various market conditions than stocks and bonds – making them desirable from a diversification perspective.” This diversification, not seen with a traditional stock/bond portfolio, is critical in certain situations. For example, between 1973 and 2013 “commodity returns increased as inflation increased.” This dynamic is not true for stocks.
Detractors may cite that gold is a more volatile asset. However, it’s important for investors to consider this characteristic in relative terms. That is, gold, should represent one piece of a larger portfolio strategy that includes a variety of assets. The concept of viewing the risk profile of an investment (e.g. gold) within the broader context of a complete portfolio is the underpinning to Modern Portfolio Theory. The ideas behind this theory were first explored in 1952 when Harry Markowitz published his seminal work. He argued that the key to making this approach work is selecting a group of investments that, in aggregate, represent less risk than any of the assets alone. The key: the risks of these different holdings cannot be related.
As outlined earlier, culling a group of investments that have differentiated risks is more challenging than ever thereby putting the tenets of MPT further out of reach. Gold helps investors get closer to true diversification in the midst of our narrowing world. Why? Because there’s only about 183,000 tons of gold above ground. That total is unlikely to increase as mining operations are forced to work harder and spend more to extract the increasingly scarce resource. Corporate boards cannot simply issue more shares or split the stock.
Give consideration to what amount of gold is the right proportion for your portfolio.


