


5 U.S. Hidden Treasures Still Waiting To Be Discovered
Posted on — 1 Comment- Mosby’s Treasure in Virginia
- Idaho Stagecoach Robbery Treasure
- Pirate Treasure at Hawaii’s Palemano Point
- Gangster John Dillinger’s Suitcase Filled With Cash
- Jesse James And His Band of Outlaws Lost Loot in Oklahoma
The allure of hidden treasure and sudden riches is strong. The possibility of a huge stash of gold, silver, jewels, cash and more has driven treasure hunters on expeditions throughout history. Today we highlight five hidden treasures that are still waiting to be discovered – right here in America – somewhere in Virginia, Idaho, Hawaii, Wisconsin and Oklahoma. From pirate treasure to stagecoach robbery loot to suitcases filled with cash – who will be the lucky person to discover these hidden treasures? Are these myths or are they true? Only time will tell.
1. Mosby’s Treasure in Virginia
It is said that somewhere deep in the heavily forested woods of Fairfax County, Virginia, a large treasure is hidden. At the time it was buried, this treasure including gold, silver, jewelry, candlesticks, and other family heirlooms, all of them taken by Union troops from southern homes. At the time, the value of the treasure was estimated to be about $350,000. Today? Estimates put the value at more than $6 million.
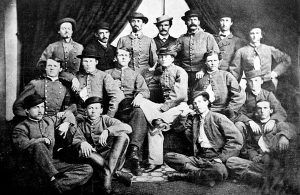
In 1863, Confederate ranger John Singleton Mosby and his band of raiders snuck ten miles deep into Union territory. After a successful capture of Union troops at the Fairfax, Virginia courthouse, Mosby sped back toward the Confederate line. However, before he got back to Southern territory, he was warned that Union soldiers were nearby. As the legend goes, Mosby buried the treasure in a burlap sack between two trees. He marked the spot with his knife. While he later sent his men back to recover this treasure, they were captured and killed. It is believed this hidden treasure remains undiscovered to this day.
2. Idaho Stagecoach Robbery Treasure
In the early days of the Idaho territory, stagecoaches provided transportation for people and goods along the routes from Montana to Utah. On July 26, 1865, bandits knows as the Picket Coral Gang held up a stagecoach carrying two large strongboxes filled with gold, including 15 heavy gold bars, and pouches with gold dust and nuggets. While many of the passengers died in the hold-up, a survivor fled to a nearby town and identified the notorious gang. Vigilantes gave chase and soon overcame the bandits killing them all. They had a total of $50 between them. To this day, there is no record of the gold bars ever being sold. Some speculate the loot was buried in the Portneuf Canyon. Who may find this treasure today?
3. Pirate Treasure at Hawaii’s Palemano Point
As the legend goes, 16th century English pirate Captain Thomas Cavendish is said to have buried $5 million in gold, silver, and other valuables near Palemano Point, an exposed reef just off Hawaii’s Big Island. While treasure hunters have tried for hundreds of years, no one has yet to unearth this bounty of Hawaiian riches.
4. Gangster John Dillinger’s Suitcase Filled with Cash in Wisconsin
Known as Public Enemy Number One, one of America’s most famous gangsters, John Dillinger, is said to have buried $200,000 in cash in a suitcase in the Wisconsin woods, just months before his death in 1934.
Dillinger and his men spent the spring of 1934 hiding out at the Little Bohemia Lodge near Manitowish Waters, Wisconsin. The FBI raided the lodge after a phone tip disclosed the gangster’s location. During the shootout, Dillinger escaped out the backdoor with his suitcase filled with cash. According to legend he ran 500 yards north into the woods and dug a hole near two pines and an oak and buried the suitcase. Three months later, Dillinger was shot and killed outside the Biograph Theater in Chicago by federal agents, who had been tipped off by Dillinger’s girlfriend’s landlady, known as “the woman in red.” No one has ever reported finding that suitcase to this day.
5. Jesse James and his band of outlaws lost loot in Oklahoma
If you’ve heard of large treasure of gold from the Wild West era supposedly hidden by Jesse James and his band of outlaws in the Wichita Mountains of Oklahoma, you aren’t alone. For generations, treasure hunters have sought to find an estimated one to two million dollars’ worth of gold bullion hidden by the infamous Jesse James in that mountain range.
James and his brother Frank had strong family ties to Oklahoma. Throughout the Midwest, the pair notoriously robbed trains and banks making them some of the wealthiest outlaws of their day. In 1872, James robbed a Mexican Caravan, owned by a Mexican General near Geronimo, Oklahoma. While being pursued by a posse, James is said to have buried that gold bullion in the Wichita Mountains and it has never been found to this day.
Want to read more? Subscribe to the Blanchard Newsletter and get our tales from the vault, our favorite stories from around the world and the latest tangible assets news delivered to your inbox weekly.
How Gold Performs in “Left Tail” Events
Posted on — Leave a commentAn event that has a small probability of occurring is sometimes called a tail event. The “tail” is the sloping far left and right sides of a normal distribution curve. These are the areas that sit outside the main bulge of the curve. 
If the tail represents uncommon outcomes, why do they matter?
They matter because when they do happen, they often present dramatic outcomes.
In his 2007 best-seller, The Black Swan: The Impact of the Highly Improbable, author Nassim Taleb explored the concept of tail risk. The message of the book is clear: we are often blind to randomness and this blindness leaves us unknowingly exposed to risks that can have devastating consequences. While these risks are unlikely, people need to be prepared for them. If they ignore them, they are choosing to ignore events that could have permanent consequences.
The “tail” however, is not always something to fear. When considered in the context of a diversified portfolio, the tail represents both threats and opportunities. Consider that “gold tends to outperform in left-tail events,” according to research recently published by the World Gold Council.
This out-performance does not necessarily look like skyrocketing returns. Sometimes, an outperforming asset is one that maintains its value in a setting in which most other assets plummet. This characteristic of gold is important because, as Taleb argues, the world we live in is becoming increasingly fragile. This is a result of increasingly interconnected financial systems in which each individual part can have a massive impact on the whole
Others have explored this idea. In his book Normal Accidents, author Charles Perrow warns that “we create systems—organizations, and the organization of organizations—that increase the risks for the operators, passengers, innocent bystanders, and for future generations.”
Taleb summarizes that “the great danger has always been too much connectivity.” Herein lies the power gold has to add stability to a portfolio. Research from the World Gold Council finds that the correlation between gold and the stock market becomes more negative as equity market moves intensify. In other words, as the S&P 500 experiences larger swings, gold increasingly moves in an opposite direction.
Today, we can see the impact of our interconnected world. The pandemic put more cash in peoples’ hands, due to both sheltering in place and government stimulus. This led to more spending, which led to inflation. As a result, the government has been raising rates to cool the economy. This, in turn, has boosted gold prices, as seen by a 12% on a year-over-year increase in demand for the metal in the first half of 2022.
This chain of events shows both the connectedness of our financial systems and the way in which gold acts as a stabilizing force. This stability will be increasingly important as we enter a new setting in which inflation remains stubborn and as the era of cheap money comes to an end.
Want to read more? Subscribe to the Blanchard Newsletter and get our tales from the vault, our favorite stories from around the world and the latest tangible assets news delivered to your inbox weekly.
The U.S. Trade Dollar
Posted on — 1 CommentThe Trade Dollar is an interesting example of how expanding global trade can give rise to new coins.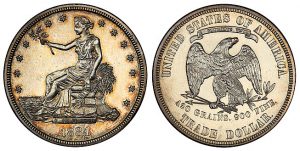
In the mid-1800s, the Mexican peso was a highly valued means of exchange in China. In contrast, the American silver dollar was far less popular due to its relatively light weight. This meant that American merchants had no choice but to use Mexican and Spanish currency when engaging in commerce.
Around this time, Louis Garnett, who served as both the treasurer and assayer of the San Francisco Mint, suggested that the U.S. create a new commercial dollar for export to East Asia. The intent was for this new coin to compete with other trade coins that were already well-established in those areas.
By 1872, there was a bill before Congress seeking authorization for such a coin. Around the same time, the Mint began to strike several commercial dollar designs in preparation for the new piece upon passage of the bill. Eventually, it was decided that the design would show Liberty as represented by a seated figure facing left, a reference to the direction of East Asia. The obverse showed a bald eagle as required by law. Interestingly, the image of the eagle on this coin was a reversal of most other coins of the era given that the eagle held three arrows in its right claw and an olive branch in its left.
After the coin was minted and circulated, Henry Linderman, American financier and superintendent of the U.S. Mint, ordered a review of the coin’s acceptance in China. He learned that the coin was fairly well circulated in southern China but failed to experience widespread usage in the north.
Around this same time, Congress passed the Specie Redemption Act which gave the Treasury permission to pay silver coins in exchange for paper currency. This decision, coupled with a drop in silver prices, led to an increase of silver coins in American transactions and Trade Dollars started flowing back into the US. Soon, the intrinsic value of the coin sunk below one dollar and by late July of 1876 Congress passed a bill that officially demonetized it.
Despite this, Trade Dollars remained in circulation and some employers in the US started to pay workers with them, as they could be purchased at a discount as the price of silver dropped. In response, many towns set a fixed value on the coins. Problems intensified as bullion prices continued to drop through the 1880s, which exacerbated losses among those who paid face value and ultimately were forced to sell at melt value.
Eventually, Trade Dollars were once again made legal tender upon passage of the Coinage Act of 1965. Today, the bullion and numismatic value of the Trade Dollar is greater than its face value of one dollar.
These coins, consisting of 90% silver and 10% copper, represent the confluence of change seen in American commerce in the late 1800s when commodity process, competing currencies, and international trade all influenced the fate of the Trade Dollar.
Want to read more? Subscribe to the Blanchard Newsletter and get our tales from the vault, our favorite stories from around the world and the latest tangible assets news delivered to your inbox weekly.
Gold Soars After Fed Hikes Interest Rates To A 16-year High
Posted on — 1 CommentFed Hikes Interest Rates for Tenth Time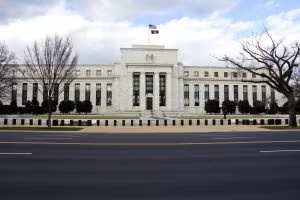
Investors turned to the safety of gold and silver after the Federal Reserve hiked interest rates for the tenth time in its battle against America’s public enemy number one: inflation.On Wednesday, the Fed increased its benchmark interest rate by 0.25% to 5.0-5.25%, a 10-year high. Gold and silver both traded significantly higher after the Fed meeting.Are Rate Hikes Over?In a hint of what lies ahead, central bankers removed a key phrase from their last policy statement, which said some additional policy increases might be appropriate. Wall Street experts reading between the lines say that means the Fed might be done hiking interest rates for now.Another Bank FailureThis week’s interest rate hike from the Fed comes on the heels of the second largest U.S. bank failure in history. Last week, federal regulators seized failing San Francisco-based First Republic Bank and sold it to banking giant JP Morgan. We have now seen three of the four largest ever U.S. bank failures unfold in the last two months.The banking collapse of 2023 is now officially bigger than the banking collapse of 2008. Yes, you read that correctly.Collectively, the three big banks that have collapsed in 2023 had more assets than all 25 banks that collapsed in 2008 did.Gold Outlook PositiveSentiment towards precious metals remains positive, as investors seek an asset that will not only help grow their wealth, but also protect and preserve it. Citigroup recently forecast additional near-term gains for gold, with a price forecast of $2,300. That would stand as a new all-time high for the yellow metal.Inflation Still Too HighDespite the Fed’s ten interest rate hikes since March 2022, inflation remains stubbornly high and well above the central bank’s 2% target inflation rate. The most recent data shows that consumer inflation is still too hot at 5% in March. Inflation continues to destroy the wealth of Americans every day.The Bottom LineWith a potential recession on the horizon, still-high inflation, uncertainty over the stability of the banking sector, and a debt ceiling crisis looming, it’s no surprise that gold and silver are gaining ground. The uptrend for precious metals is strong and there is still opportunity to lock in future price gains if you increase your allocation to gold now.Historically, gold climbs in the months ahead of and after a recession. With an economic slowdown already in the works, it’s time to consider if you own enough gold.
Want to read more? Subscribe to the Blanchard Newsletter and get our tales from the vault, our favorite stories from around the world and the latest tangible assets news delivered to your inbox weekly.
Top Five Most Valuable Shipwrecks
Posted on — Leave a commentList of top five most valuable cargo on shipwrecks
Shipwreck gold and silver hold a special place in many collectors’ hearts. Due to their dramatic history, rarity and against-all-odds type of survival – that it could ever be recovered from the depths of the ocean floor – these pieces are highly sought after within the numismatic world. We feature the top five most valuable shipwrecks in history.

The San José: estimated $17-$20 billion
Three centuries ago, the English navy ambushed a Spanish treasure fleet loaded with billions of dollars (in today’s value) of gold, silver, jewel and other valuables. The Columbian navy located this shipwreck in 2015, yet the government fighting over who owns the treasure has kept the remarkably preserved hoard on the ocean’s floor. The Columbian government claims ownership of the ship and its treasure, yet under international law Spain still owns the San José.
What happened: On June 8, 1708, the San José, a three-masted galleon was attacked off Cartagena, Colombia, by a British squadron under the command of Captain Charles Wager. During the treacherous fight on the open sea, the San José was hit badly and sank with an incredible cargo of gold and silver coins, emeralds and other valuables.
Today, the Colombian navy says cannons, coins and gold bars can be seen lying on the seafloor in pristine condition. The ship lies on the ocean floor at a considerable depth of around 2,000 feet, which keeps it out of the sunlight that sustains marine organisms – and experts believe this is what has allowed the shipwreck and its value to be so well preserved.
Today, the exact location of the wreck is a closely guarded secret. Rare coin collectors can expect a salvage operation to occur at some time in the future, which would create an incredible buying opportunity for numismatic investors. Stay tuned.

The Nuestra Senora De Atocha: $400 million
Experts call the Nuestra Senora De Atocha “greatest treasure ever found,” in terms of total value and difficulty to salvage. The ship was built in Havana Harbor and left the port on September 4 1622. La Nuestra Senora de Atocha was one of twenty-eight vessels in the Terre Firme Fleet, heading to Spain with trade goods and treasure. One day later on September 5, a massive hurricane struck the fleet just 60 miles off the coast of Cuba. That day, 260 souls lost their lives as the ship sunk in the deadly storm. Only five survivors were found, who clung to life by hanging onto the mizzen, which remained above the water.
In July 1985, Mel Fisher and a team of divers discovered the shipwreck off the Florida Keys. The valuable cargo included $400 million of treasure including 24 tons of silver bullion, ingots, and coins, 125 gold bars and discs and 1,200 pounds of silverware. The coins were minted in the New World Spanish colonies and the hoard also included Colombian Emeralds from the famed Muzo Mine.

S.S. Central America: over $300 million
In September 1857, a 280-foot, wooden-hulled steamer called the S.S. Central America set sail for New York from San Francisco. Known today by numismatics as the fated “Ship of Gold” this steamer carried 578 souls and over two tons of gold and coins from San Francisco, worth an estimated $8 million at the time. Sadly, this legendary ship sailed straight into a Category 2 hurricane off the coast of the Carolinas.
She took on water fast and the 105 mph winds shredded her sails. The crew bailed water all night long valiantly fighting back against the monster storm. Two ships came to their rescue and transported 153 of the passengers to safety in lifeboats. Eventually, the captain fired his final rocket – a signal the ship would soon go under. Tragically, 425 passengers died as the ship sunk.
For 131 years, her treasure worth $300 million in today’s dollars – sat at the bottom of the ocean. In 1988, a team discovered the ship 160 miles off the coast at a depth of 7,200 feet.
A total of 346 Kellogg & Humbert ingots were recovered from the ocean floor. Blanchard placed a number of these stunning and historic gold ingots. One memorable ingot that Blanchard placed reveals the words: .892 fine $453.23. In 1857, gold was priced at $20.67 ounce.

S.S. Gairsoppa: $210 million
In early 1941, WWII German submarines were hunting Allied ships and that is how the legendary S.S. Gairsoppa, a British merchant freighter met her destiny. The S. S. Gairsoppa was steaming from Calcutta, India to London, loaded with valuable cargo including 7 million ounces of silver bullion, tea and pig iron.
In mid-February, a North Atlantic tempest whipped the seas into a violent frenzy and in attempt to survive, the Gairsoppa set a new course for Galway, Island, away from the deadly storm. Moving slowly due to her valuable and heavy cargo – the ship was a sitting duck for the aggressive German subs on the prowl. A German submarine U-101 sunk the ship with one torpedo. It was February 17, 1941 when Gairsoppa sank in the North Atlantic, falling to the bottom of the ocean, nearly three miles below the water’s surface. Only the freighter’s second officer survived, all other souls onboard perished that day.
For 70 years, the Gairsoppa shipwreck sat undiscovered and untouched by man. Then, in 2013, Odyssey Marine Exploration identified the location of the Gairsoppa shipwreck and started the painstaking process to recover the silver bullion from the shipwreck on the ocean floor. The July salvage operation of the Gairsoppa was the deepest and heaviest recovery of precious metal from a shipwreck site in history.

Titanic: $218 million
You may have seen the 1997 film Titanic which chronicled the epic story of the sinking of the RMS Titanic. Tragedy struck in April 1912 after Titanic hit an iceberg on her maiden voyage from England to New York City and sank. The human toll was high – more than 1,500 of the 2,224 passengers and crew aboard died.
Seventy three years later, a joint venture between Woods Hole Oceanographic Institution (WHOI) out of Woods Hole, Massachusetts, and French National Institute of Oceanography (IFREMER), Toulon, France set out to find Titanic. The objective was to test to the functionality of newly developed underwater imaging systems – which succeeded when they found the wreckage in September 1985.
While the Titanic was a passenger liner, the salvaged treasures included a substantial amount of cargo ranging from the mundane like mail and furniture to bullion, coins, and jewelry to a 1912 Renault Type CE Coupe de Ville motor car and even a jeweled copy of the Rubaiyat of Omar Khayyam.
Want to read more? Subscribe to the Blanchard Newsletter and get our tales from the vault, our favorite stories from around the world, and the latest tangible assets news delivered to your inbox weekly.
Three Most Famous Coin Collections
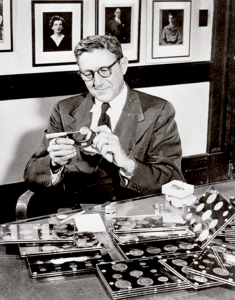
Posted on — 2 CommentsWhat do Louis Eliasberg, Bob R. Simpson and Harry W. Bass have in common? They all amassed one of the finest-known coin collections in American history.
The Louis Eliasberg Collection
Louis Eliasberg was born in Selma, Alabama in 1896, the son of a dry goods and clothing dealer. He wasn’t born into wealth and yet he amassed his incredible rare coin collection slowly over time, with hard work, patience and persistence.
Today, Louis Eliasberg is a legend in the numismatic world. Nicknamed the “King of Coins” – the U.S. postal service once delivered a letter to him addressed merely King of Coins USA, with no address.
What makes the Eliasberg collection special? Eliasberg, a Baltimore banker, was the only known numismatic collector who assembled a complete collection of United States regular issue coins ever minted by denomination, date and mint all the way back to 1792. Starting in 1925, Eliasberg began purchasing U.S. coins and achieved his monumental goal by 1950. His collection is considered to be one of the greatest coin collections in U.S. history.
He compiled his entire collection for less than $400,000. After his death in 1976, Eliasberg’s unmatched collection passed down to this two sons. Neither of them shared their father’s passion for numismatics and eventually auctioned off the coins for an estimated $45 million.
Eliasberg was a man known to distrust paper money and was forever unhappy that FDR removed the United State from the gold standard. In his mind, hard metals were the only currency that was trustworthy.
Bob R. Simpson Collection
Texas oil billionaire Bob Simpson is co-chairman of the Texas Rangers baseball team, a philanthropist and a co-founder of XTO Energy, a natural gas firm acquired by ExxonMobile in 2010.
Simpson, now in his 70’s , wasn’t wealthy when he began collecting coins as a young boy. While other boys his age were collecting baseball cards, he would go to the bank, get a roll of coins and look for the most interesting. He was searching for Mercury dimes – the most famous, the 1916-Ds, were still being found in bank rolls back then. He also kept an eye out for copper pennies and Walking Liberty half-dollars.
Simpson’s collection, which is legendary in coin collecting circles, contains remarkable rarities with a particular focus on U.S. patterns. He purchased several large pattern collections over a period of years, spending more than $36 million on a single pattern collection in 2007. Notably, Simpson was the first person to ever assemble a complete P-D-S set of bronze-planchet 1943 Lincoln cents. That includes a 1943-S bronze cent that he paid $1 million for in 2012. Simpson’s collection is ranked by Professional Coin Grading Service as one of the best ever amassed.
In recent years, Simpson has sold off highlights of his legendary numismatic collection, which have so far totaled more than $54 million in sales. In 2021, Blanchard placed a 1910 Proof Gold $2.5 Indian Head, which was part of Simpson’s incredible collection.
He views himself as a steward of these remarkable rarities and said recently it is time for someone else to enjoy them. “I think coins should be appreciated almost as artwork,” he said. “I have gotten more than enough joy from them.” Simpson was asked if he viewed coin collecting as risky? “I viewed it as the opposite, as a haven more than a risk asset,” Simpson said.
The Harry W. Bass Collection
Starting in the 1960’s, Harry W. Bass, a Dallas born businessman, began collecting U.S. coins and ultimately created one of the most spectacular U.S. gold collections ever.
Notably, Bass assembled a set of virtually all known die varieties of early U.S. gold coin denominations in the finest condition. Bass carefully assembled the only complete collection of $3 gold pieces, including the rare 1870-S; plus a complete collection of U.S. gold coin types from 1795 to 1933; and an impressive grouping of rare U.S. pattern coins.
While Bass passed in 1998 and his collection was largely sold off – the remaining coins are proudly on display at the ANA’s Money Museum in Colorado Springs, Colorado.
What’s Next For Your Collection?
Blanchard encourages numismatists to acquire rare coins with a collector’s mentality. If you build your rare coin portfolio in a meaningful way it can increase the value of your total sum, in addition to bringing you greater personal enjoyment as you learn more about the time period and individual pieces. Many set collections have been sold as a whole for more than the total value of the individual coins.
If there’s a coin that you are interested in acquiring or would like advice on how to build a set talk with a Blanchard portfolio manager today. You may not become the next Louis Eliasberg, Bob R. Simpson or Harry W. Bass, but then again, maybe you will.
Want to read more? Subscribe to the Blanchard Newsletter and get our tales from the vault, our favorite stories from around the world and the latest tangible assets news delivered to your inbox weekly.
The Native American Woman Behind Lewis & Clark’s Legendary Expedition Westward
Posted on — Leave a comment“We were now about to penetrate a country at least two thousand miles in width, on which the foot of civilized man had never trod. The good or evil it had in store for us was for experiment yet to determine…I could but esteem this moment of my departure as among the most happy of my life.” –Meriwether Lewis, from The Journals of Lewis and Clark.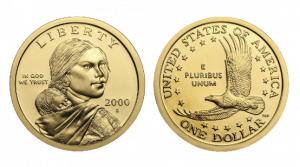
The historic 1803 Louisiana Purchase from France became one of President Thomas Jefferson’s most notable and lasting achievements. The Louisiana Purchase expanded the United States by about 828,000 square miles of territory – doubling the size of our young nation.
After the purchase, the door opened for quick expansion westward for adventuresome Americans. President Jefferson quickly commissioned the legendary Lewis and Clark expedition to explore the lands acquired in the Louisiana Purchase. Jefferson tasked the intrepid explorers to survey the terrain, create maps, learn about the Native Americans who lived on that land, and collect scientific specimens of plants and animals.
Jefferson’s secretary, Meriwether Lewis, led this remarkable adventure through the wilds westward. Lewis, 29, asked his friend and former military superior, 33-year-old William Clark, to be his co-captain on the expedition westward from the Mississippi River to the Pacific Coast.
Sacagawea’s Valuable Language Skills
The team was fortunate to have Sacagawea, a Native American Shoshone woman, as their interpreter and guide on their journey from 1804-1806. Sacagawea contributed greatly to the expedition’s success.
Sacagawea’s language skills as a translator were invaluable as they encountered Native Americans who might otherwise have gone into attack mode against the strangers in their land. It is said that Sacagawea and her infant served as a “white flag” of peace for the expedition westward, as war parties did not include women and infants. Not a single member of the Lewis & Clark party was lost to hostile action.
Sacagawea was bilingual in two very different Native American tribal languages – Hidatsa and Shoshone. Her husband spoke French, English, and Hidatsa. This translation chain was viewed as extremely valuable. Lewis and Clark needed all the help they could get communicating with the Shoshone tribes at the headwaters of the Missouri River.
Astoundingly, Sacagawea accompanied the legendary group on this difficult and long journey all while caring for the son she bore just two months before departing.
The Golden Coin that Honored the Legendary Native American Woman
In 2000, The United States Mint bestowed a great honor on Sacagawea’s memory and her significant contributions to the early explorations of our great nation with the production of the Sacagawea Golden U.S. Dollar coin. The coin was minted under the auspices of the United States $1 Coin Act of 1997.
Sculptor Glenna Goodacre’s design won a national design contest for her representation of Sacagawea with her infant son, with the reverse side of the coin featuring an eagle representing peace and freedom.
By and large, the majority of gold Sacagawea coins are not rare and circulated coins do not carry numismatic value. They are also not true gold coins, despite the golden color. The coins were composed of primary copper (77%), with small portions of zinc, manganese, and nickel.
The coins still circulate today, but proved to be ultimately proved to be unpopular with the public and are not widely used.
Golden Proof Coins in Space
Interestingly, 39 Proof 2000-W Sacagawea Dollar coins were struck in 22 Karat gold at the West Point Mint in June 1999. While 27 were ultimately melted, the remaining dozen examples took a journey into space on board the space shuttle Columbia. The coins returned to earth five days later on July 22, 1999. The dozen gold Sacagawea proofs were then sent to the Gold Bullion Depository in Fort Knox, Kentucky.
Some Circulating Sacagawea’s Are Valuable
There are a few key dates that are rare and have value beyond the $1 mark on the coin. The U.S. Mint embarked upon partnerships with both Wal-Mart and General Mills to promote the use of the Sacagawea coin in commercial transactions. The partnership with General Mills included 10,000,000 boxes of Cheerios cereal that would contain a Lincoln cent as a prize or a new Sacagawea dollar. Some lucky Cheerios breakfasters would receive a certificate redeemable for 100 Sacagawea dollars.
Some of the gold Sacagawea coins that were found in the Cheerios boxes were struck from a different set of dies. Within numismatic circles, these coins which showed “high detail” and enhanced eagle feathers on the reverse side of the coin became known as the “Cheerio Dollars” or “enhanced reverse die.” These are valuable and depending on the grade have sold for $5,000 to $25,000.
Want to read more? Subscribe to the Blanchard Newsletter and get our tales from the vault, our favorite stories from around the world and the latest tangible assets news delivered to your inbox weekly.
1936 Elgin Half Dollar
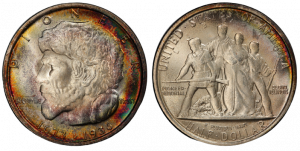
Posted on — 2 CommentsThe Elgin Illinois Centennial half dollar honors the founding pioneers of Elgin, Illinois located 30 miles west of Chicago. Founded in 1835, the area eventually became a village by 1847, then finally a city in 1854.
The first person to suggest commemorating the town was Trygve Rovelstad, the son of Norwegian immigrants in the U.S. As a sculptor, he decided that he would erect a statue in Elgin to remember the pioneers that settled the town. He eventually got approval from city officials and prepared a foundation for the statue in 1934. However, not long after, Rovelstad ran into financing problems and was unable to generate the money needed. Then he had an idea.
Rovelstad decided that he could raise the money through the issuance of a commemorative coin. In 1935, he arranged for a bill to be introduced to Congress authorizing a half dollar that would commemorate Elgin’s centennial. Again, Rovelstad ran into problems, as the bill was not considered.
That same year, Rovelstad met Lyman W. Hoffecker, a coin dealer from El Paso, Texas who had learned of the bill and took an immediate interest in the project. Hoffecker offered guidance on how to earn approval from Congress. Importantly, he also offered to handle the distribution of the coins. Determined to make these coins a reality, Hoffecker didn’t reveal to Rovelstad that he was a coin dealer and even warned him in a letter that “it would not be good for either of us if the word got out you had disposed of the entire issue to me.”
By the end of 1935, Hoffecker offered to pay the Elgin committee $12,000 and sell the coins for $2.00 each. He offered to advance the Mint the face value of the coins while also covering engraving and shipping charges.
The collaboration between Rovelstad and Hoffecker was finally enough to get the bill passed and signed by President Roosevelt in 1936. The mint quantity was set at 25,000 coins and would be paid for by the Elgin committee. The Philadelphia Mint handled the issuance and, by the end of 1936, they had struck all 25,000 pieces.
The obverse of the coin shows the profile of a pioneer and the reverse shows a group of four adult pioneers and a baby in its mother’s arms. The reverse image was, in fact, a bas relief of the model that Rovelstad originally intended for his statue. This image also appeared on the medal Rovelstad designed for Elgin’s centennial along with the words “to the men who have blazed the trails, who have conquered the soil, and who have built an empire in the land of the Illini.” The final design of the coin included “Elgin, Illinois” at the suggestion of Hoffecker.
As planned, Hoffecker sold the coins directly to collectors at the issue price rather than to speculators or dealers. Ultimately, he was able to sell about 20,000 of the total minting, with the remaining coins being returned to the Mint for melting.
In the end, Rovelstad was successful, though he did not live to see his final work. In 2001 his memorial was completed. It was all possible due to the popularity of the Elgin half dollar.
Want to read more? Subscribe to the Blanchard Newsletter and get our tales from the vault, our favorite stories from around the world and the latest tangible assets news delivered to your inbox weekly.
Gold and Silver Are Winners: Debt Ceiling Looms As another Catalyst to Keep Precious Metal Rally Going
Posted on — 1 CommentFrom bank failures to rising interest rates and still high inflation, investors around the globe are rushing into precious metals for safety, portfolio diversification, and as an asset to grow their wealth.
Gold is up 10% since the start of 2023 and recently raced above the $2,000 an ounce level. Silver is up 4% and looking ahead Wall Street remains positive on precious metals. Citigroup has a bullish forecast for gold climbing to the $2,300 ounce level in the near-term. And, a new forecast from a BofA Global Research report says a gold market close above $2,078 on both a daily and weekly basis “would go a long way in signaling significantly larger upside…such as $2,391/2,543.”
Shifting to the macroeconomic environment for a moment, some may wonder what could be the next catalyst for another upleg in gold?
Two words: Debt ceiling.
While the debt ceiling confrontation has fallen to the background in the wake of the banking system turmoil, it still has potential to trigger a new round of chaos in the financial markets.
Congressional leaders are bracing for a high-stakes standoff over raising the debt ceiling in the months ahead. Back in 2011, Congress took the nation to the brink of default with its in-fighting over raising the debt ceiling. Those political shenanigans were costly – the incident resulted in a Standard & Poor’s downgrade of U.S debt. Barron notes that that has meant the yield on U.S. Treasuries has consistently been one to two percentage points higher than German government bonds since that time.
What could this mean for gold in 2023?
The last time Congress held the debt ceiling hostage and took the U.S. to the brink of default was in August 2011 and gold soared to its then all-time high above $1,900, as global investors turned to the precious metal as a safe haven.
A debt ceiling standoff 2.0 in 2023 would open the door for another round of massive gold buying, as investors rush to the safety of precious metals, which are attached to no government debt or obligations like the U.S. dollar is.
What could happen if Congress doesn’t raise the debt ceiling and the U.S. defaults on its debt payments?
As we’ve talked about before, a Congressional failure to raise the debt limit would destroy the global market’s confidence in American Treasuries and the U.S. Dollar the reserve currency. It would trigger a recession in the U.S., causing millions of Americans to lose their jobs and the stock and bond markets would crash. Social Security checks would stop coming. Interest rates would soar because in order to continue funding the massive U.S. debt, America would be forced to pay extremely high rates of interest on new bonds because no one would trust Treasuries anymore.
This is a dark scenario indeed, and one that we hope our politicians will never create. It would be a self-induced economic crisis – perhaps one of the most serious that you have ever seen in your lifetime.
In the meantime, gold has become a favored asset of choice in 2023. It’s no surprise. Gold offers investors so many tangible benefits – including a physical asset they can own and hold in their hand. Gold has no counter-party risk and you can have access to physical metals you own at any time you like.
If the current economic environment has you questioning, it may be time to consider increasing your allocation to physical metals. Consider trading some of your U.S. dollars for gold. Investing in gold and silver offer you peace of mind in ownership of an asset that has served as a store of value for thousands of years – and can protect and grow your wealth today.
Want to read more? Subscribe to the Blanchard Newsletter and get our tales from the vault, our favorite stories from around the world and the latest tangible assets news delivered to your inbox weekly.
Gold Races above $2,000: Three Reasons It Can Keep Going Higher
Posted on — 1 CommentGold soared through the $2,000 level yesterday fueled by steady investor buying following weaker-than-expected economic reports and a big jump in crude oil prices. The early April OPEC announcement of a planned crude oil production cut triggered a 6% jump in oil prices to $80 per barrel. And, higher crude oil prices can boost the already high levels of inflation in the economy.
Investors turned to the safety of gold in recent weeks amid bank failures, concerns about recession, rising interest rates and still-high inflation. The shiny yellow metal soared 12% in the past month and has climbed 25% from its November low.
You may be wondering – can gold still climb higher? Citigroup says yes – with a near-term price forecast of $2,300, which would stand as a new all-time record high. The current record high for gold sits at $2,059.90, scored in 2020.
Here are three reasons gold can still climb higher from here.
The U.S. dollar slid to its lowest level since February this week. The dollar is in a downtrend, has been declining since its October 2022 peak and appears to have more to fall. The recent weak economic reports increased the odds that the Federal Reserve will need to pull back on additional aggressive interest rate hikes to fight inflation, ultimately meaning that the fed funds rate will peak out at a lower rate than previously expected.
Because gold is bought and sold in U.S. dollars on the world marketplace, an ounce of gold is worth more dollars when the greenback weakens. As the dollar weakens even more, it creates additional momentum for gold to climb higher.
2. Falling Bond Yields
Bond yields are falling, which increases the attractiveness of gold as a portfolio diversifier and safe haven asset. Two-year U.S. Treasury note yields slid from 5.1% last month to 3.8% this week.
3. Increased Risk Aversion
Investors worldwide have been spooked by the recent bank failures, worries about a U.S. recession, and high inflation that the Fed just can’t seem to get rid of. Gold has served as a store of value for thousands of years and in times of uncertainty, precious metals increase in value. As worries about systemic financial system risk grow, investors are moving assets into gold, which has no counter-party credit risk.
It’s not too late to buy gold. Precious metals are in an uptrend and have more room to run.
Want to read more? Subscribe to the Blanchard Newsletter and get our tales from the vault, our favorite stories from around the world and the latest tangible assets news delivered to your inbox weekly.


