


How Queen Elizabeth’s Death Will Impact Currency Globally
Posted on — Leave a commentQueen Elizabeth – the world’s longest reigning monarch – was the face of the U.K.
Even since her death on September 8th, her image remains a symbol of the country. The most lasting example of this is her portrait which has been on U.K. coins and banknotes since 1960.
With almost 5 billion U.K. banknotes circulating in the U.K., her picture is everywhere. In fact, her face can be found on the currency of 35 different nations. Her death has left some questioning if this will change.
The U.K. government has not signaled their intentions yet but precedent dictates that banknotes, coins, and stamps must change when a new monarch takes control. While such a change is not part of a formalized law, it is a long-held tradition.
Changes in the currency – like Queen Elizabeth’s reign of 70 years – are likely to unfold over a long period. It will require several years for officials to design, and print new banknotes and coins. Some estimates indicate that changing banknotes in the U.K. will take at least two years.
The royal family will need to commission an official portrait of King Charles III before proceeding with design changes. Before this happens the Royal Mint will continue to issue the current form of currency with the Queen’s image and has stated that they will remain legal tender.
In the meantime, nations circulating currency with the queen’s image will need to decide how, and if, they want to change their banknotes and coins. In Canada, a former British colony, the currency in circulation which depicts Queen Elizabeth on coins and the 20-dollar banknote will remain in circulation. The Royal Canadian Mint intends to keep this design in use for years to come.
Australia, another former British colony, is also in no rush to change the look of the five-dollar banknotes featuring the queen. The Reserve Bank of Australia does intend to introduce new coins showing the King within 2023.
The Reserve Bank of New Zealand has explained that they will wait until all of their current banknotes and coins featuring the Queen’s image are depleted before issuing new coins and paper currency with the King’s image.
These plans, and those of other countries, illustrate just how ubiquitous the Queen’s image has become over her lifetime. In 1935, at the age of 9, her image first appeared on the 20-dollar Canadian note. It would be another 35 years before the U.K. made her portrait part of their currency.
When the U.K. finally does alter their currency they will almost certainly feature King Charles III facing left on coins. This is part of a tradition in which a new monarch’s profile is shown facing the opposite direction of the monarch they have replaced. Queen Elizabeth’s profile always faced right on coins during her reign.
What remains clear is that Queen Elizabeth’s image will remain part of global currency for several more years. Throughout all of history no ruler has appeared on more legal tender that the Queen. That record is unlikely to be broken anytime soon.
Today the image of Queen Elizabeth II appears on currencies in 35 different nations some of which are dependencies of the UK. They are:
1. UK
2. Australia
3. New Zealand
4. Canada
5. Bahamas
6. Belize
7. Bermuda
8. British Virgin Islands
9. Cayman Islands
10. Dominica
11. East Caribbean States
12. Jamaica
13. Turks Caicos
14. Falkland Islands
15. St. Helena
16. Tristan da Cunha
17. South Africa
18. Rhodesia
19. East Africa
20. Nigeria
21. Mauritius
22. Seychelles
23. Hong Kong
24. Malaya British Borneo
25. Tokelau
26. Fiji
27. Kiribati
28. Papua New Guinea
29. Solomon Islands
30. Tuvalu
31. Cyprus
32. Gibraltar
33. Guernsey
34. Jersey
35. Isle of Man
Want to read more? Subscribe to the Blanchard Newsletter and get our tales from the vault, our favorite stories from around the world and the latest tangible assets news delivered to your inbox weekly.
Six U.S. Mint Error Coins You Should Know About
Posted on — 13 CommentsIn 2021, the U.S. Mint produced nearly 14.5 billion coins. Despite first-class technology and extensive quality control efforts, – some mistakes happen, – and these are known as error coins, or misstrikes.
Mint error coins are one of the most intriguing categories in numismatics. Collectors value these coins according to their scarcity, and the price is determined by supply and demand. The fewer misstrike or error coins produced, the more valuable those coins are today. In fact, misstrikes and error coins typically hold a higher value than a coin in its intended condition. Some of the rarest error coins are worth $150,000 or more.
Before we highlight six valuable mint error coins, let’s explain how a few common errors occur. The cause could be a defect in the manufacturing process or even simple human error. Common mint errors include such examples as a double-strike coin. You can see a good example of this in the second entry. These occur when a struck coin goes back into the press and is struck a second, or even third time. The more times a coin was struck the higher the potential value.
A planchet is a blank disc of metal created for coinage, which could be steel, silver, gold or other metal. An off-center coin error is one that was incorrectly centered and part of the design is missing. These errors occurred when the planchet was not inserted into the press correctly. A wrong planchet coin is created when a coin is struck on a planchet meant for another denomination, or on a planchet made of the wrong type of metal.
Now let’s dive into our list of six U.S. Mint error coins that still intrigue collectors today.
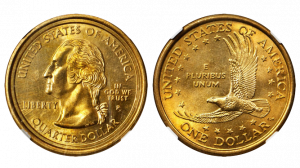
Sacagawea Dollar Reverse/Washington Quarter
In this example, the obverse design reveals a Washington quarter, while the reverse reveals a Sacagawea dollar. About two dozen of these major errors were struck at the Philadelphia Mint. These types of coins are called “mules” – coins struck using two dies intended for two different coins. Mules tend to be the Holy Grail of error coins because, while some are created intentionally, those that are true errors are exceptionally rare. This coin has sold for at least $31,600 in various auctions, and often for a great deal more by private collectors.
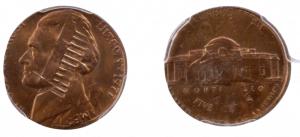
1977 Jefferson Nickel/1976 Lincoln Cent
This is a “double denomination” error (nickel and penny), and both dates are visible on the coin. You can also clearly see the Lincoln Memorial over-stamped on Jefferson’s face. These coins are fairly rare and sell for upwards of $3,000 in various auctions.
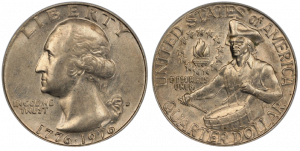
Washington Quarter Doubled Strike
This is a great example of a double – struck coin, presented with “off-center” strikes on both sides of the coin.
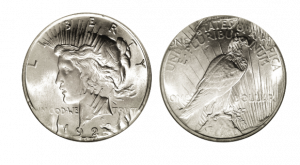
Peace Dollar Double-Strike
This formed when the coin was struck about 45% off center, but then re-positioned and struck a second time. There are many double- struck coins out there, but a double-struck Peace Dollar is a very rare find. In 2018, an example of this coin sold for over $5,000. It appeals to not only the advanced Peace Dollar collector, but the coin error collector as well.
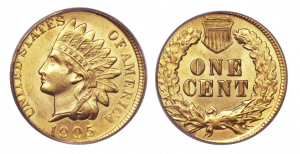
Indian Head Cent on a Quarter Eagle Planchet
Surprisingly, a gold quarter-eagle planchet was inserted into the cent- coining chamber. Due to the magnitude of this error, some numismatists suspect that this error was intentional. It would be surprising for a mint employee to accidentally feed gold planchets into a press fitted with one-cent dies. It’s far more likely that these were made for a small group of collectors. That said, we likely will never know for sure. This is one of the most valuable mint error coins available, with fewer than 10 known examples.
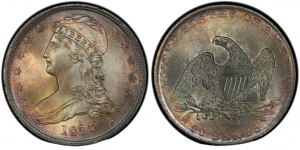
1837 Capped Bust Half Dollar
This error occurred when the coin was struck on a large cent, creating a double denomination. This error is fascinating and unique for both its series and date. In 1837, the steam press had been utilized to produce half dollars for only a little more than a year, and the coin was circulated before being placed into a collection.
This is just a short list of numerous minting errors that have occurred throughout history. Error and misstrikes coins hold a special place in the hearts of serious collectors. The appeal includes rarity, unusual appearance, and the perspective they provide into the coin- minting process. When these coins surface from collections at auction, they typically generate excitement and active bidding.
If you are interested in learning more about error coins or misstrikes, or are trying to source a specific coin, let us know. Blanchard and Company has tremendous reach and respect within the rare coin industry. If there is a particular coin or set that you are trying to build, our experts can help source your coins from collections around the world.
Want to read more? Subscribe to the Blanchard Newsletter and get our tales from the vault, our favorite stories from around the world and the latest tangible assets news delivered to your inbox weekly.
This Indian Princess Boasts A Deep Frosty Luster
Posted on — Leave a commentA $3 gold coin? During the period the $3 Indian Princess gold coins were minted, from 1854-1889, that represented a hefty sum for everyday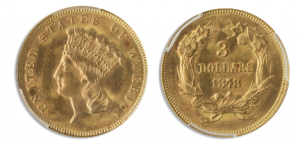 Americans.
So, why did the U.S. Mint choose to produce a $3 coin? Numismatic experts believe the reason can be found at the post office. When this coin was first minted a U.S. postal stamp cost 3 cents. The $3 coin created a convenient way for businesses to purchase 100 stamps in a single transaction.
Despite its odd denomination, many consider the $3 Indian Princess the most beautiful gold coin struck in the 19th century.
The U.S. Mint’s chief engraver, James B. Longacre designed this coin. In fact, the $3 gold coin was the first time he had been given the freedom to create a design of his own imagination. Longacre wrote that previous to the $3 gold coin, he had been directed to adapt Roman or Greek features into U.S. coins. For the $3 gold coin, Longacre was determined to create something uniquely American.
“From the copper shores of Lake Superior to the silver mountains of Potosi, from the Ojibwa to the Araucanian, the feathered tiara is a characteristic of the primitiveness of our hemisphere as the turban is of the Asiatic,” Longacre wrote.
He was inspired to feature an “Indian Princess” on the obverse of this stunning coin. A lustrous orange-gold color, the coin shows a gorgeous Indian Princess adorned with a feathered headdress, with the words UNITED STATES OF AMERICA circling her. On the reverse, the date and denomination is surrounded by an agricultural wreath celebrating corn, tobacco, cotton, and wheat.
Minted in Philadelphia of 90% gold and 10% copper, a total of 82,304 were produced in 1878. Survival estimates for all grades totals 25,000, yet for grades 60 or better only 6,000.
Blanchard recently placed an 1878 $3 Indian Princess MS64. While the 1878 issue is one of the more commonly available dates in the series, it is known from its deep frosty luster.
In today’s market, rare coin inventory is moving fast. If you see something you like, call Blanchard today. Tomorrow it may be gone.
Collecting Tip
Historically, one of the best ways to invest in rare coins is to build a set. Often sets become more valuable that the sum of the individual coins. If you are interested in starting a gold coin set or are looking for an elusive coin to complete a set, contact a Blanchard portfolio manager today for guidance. Over the past 40 years, we have helped clients build simple and elaborate sets to help meet their financial goals.
Want to read more? Subscribe to the Blanchard Newsletter and get our tales from the vault, our favorite stories from around the world and the latest tangible assets news delivered to your inbox weekly.
How Gold Will Power the Clean Technology Revolution
Posted on — Leave a commentGold is just as natural as the water and sunlight we often associate with clean tech. Yet, few people think of gold when considering the future of green energy solutions. Perhaps this is because its role in these innovations is not well publicized.
Here, we breakdown three ways in which gold will be crucial to achieving the clean technology revolution necessary to help slow global climate change.
Electricity-Producing Fuel Cells
Electricity-producing fuel cells have major implications for environmentally safe solutions because their only byproduct is water. The result is a dramatic reduction in the toxins many current technologies put into the atmosphere today. Gold serves a crucial role in the manufacturing of these fuel cells because it can be used as a catalyst during production. Importantly, gold can fulfill this role at low temperatures.
As global economies produce these fuel cells in greater numbers there will be an increasing demand for gold. Consider that the global fuel cell market is forecasted to reach $11.9 billion within the next six years. Fulfilling that level of demand will require an enormous amount of gold which is likely to increase the price of the metal.
Synthetic Polymers
Nearly every building today contains some amount of poly vinyl chloride (PVC), which is the third most widely produced synthetic polymer.
The problem with PVC is that the manufacturing process is harmful to the environment. One of the first steps requires the creation of vinyl chloride monomer which cannot be fabricated without a catalyst. These catalysts are often mercury-based. As a result, there is a greater likelihood of this harmful toxin making its way into our environment when it is discarded after the manufacturing process.
This outcome has serious repercussions because mercury has long been destructive to wildlife, especially fish. Additionally, mercury is toxic to the brain and spinal cord making its disposal particularly dangerous.
Fortunately, gold might change this characteristic of PVC manufacturing. Like electricity-producing fuel cells, gold catalyst processes have emerged which means that factories may be able to dramatically reduce their use of mercury or abandon it completely. In fact, the World Gold Council reports, “This breakthrough provides an opportunity for VCM producers to remove a highly toxic material from their process in a cost-effective manner. Depending on uptake, this application could generate total demand in the region of 1-5 tonnes of gold.”
Energy Producing Nanoparticles
Many traditional solar panels are lacking in efficiency. The reason: the panels are designed to include a web of wiring placed near the surface. This creates a problem because those wires block up to 10% of sunlight that would otherwise be used to provide electrical power.
As a result, researchers have been exploring new designs which eliminate these webs. One such concept uses a thin film of gold on a silicone sheet. This film allows more light to penetrate the panel. Some estimate that this innovation can offer up to a 20% boost in efficiency. Therefore, solar-powered technologies will likely boost gold demand. Gold has other uses in these modern panels like the electrodes used to establish electrical contact with non-metallic components.
Gold is more than an investment in a commodity. It is also an investment in the future.
Want to read more? Subscribe to the Blanchard Newsletter and get our tales from the vault, our favorite stories from around the world and the latest tangible assets news delivered to your inbox weekly.
Fed On Collision Course With Recession
Posted on — 1 CommentAmericans face rising prices, shortages of everyday goods, falling stock and bond prices and rising interest rates. Today, the Federal Reserve moved with it’s fifth super-sized interest rate hike of the year to try to tamp down the scorching hot 40-year high inflation that is eroding your wealth.
The Fed hiked its benchmark rate by 0.75 basis points to 3 – 3.25%. Gold moved slightly higher with the news, which was largely expected and priced into the markets
The recent August inflation reading confirmed what economists have long feared – inflation is broad, sticky and still rising. That means the Federal Reserve must continue to aggressively hike interest rates this year – furthering weakening the economy, as the central bank tries to choke off consumer demand for goods and services.
Higher Fed interest rates are actually designed to slow down economic growth. Higher rates mean borrowing to buy a house, a car, or even a new washer or dryer is more expensive. The Fed is deliberately trying to slow the economy.
Can the Fed hit the brakes on economic growth to bring inflation down without triggering a recession? History is not on the central bank’s side.
Yet, this bad economic dream is far from over.
Deutsche Bank economists recently said that a Fed interest rate near 5% could be needed to see meaningful improvement in inflation. Last week, billionaire investor and Bridgewater Associates Ray Dalio warned that a 4.5% fed funds rate could mean a 20% drop in equity prices.
Are you positioned for another big leg down in the stock market?
It is indeed enough to make you want to take a long nap, like our friend Rip Van Winkle, who slept for 20 years, according to the Washington Irving short story. We don’t have the luxury of sleeping through this unprecedented economic period. Fortunately, there are actions you can take today to protect and preserve your wealth in these unsettled economic times and that includes increasing your allocation to gold.
Gold is a proven portfolio diversifier, hedge against inflation and asset that is non-correlated to the stock market. Increasing your allocation to physical gold today is a strategic method to protect your portfolio from further dislocation and declines as the Fed continues its aggressive interest rate hike campaign. If you’d like a personalized portfolio consultation to review your current portfolio and how gold ownership can help you achieve your long-term financial goals, call a Blanchard portfolio manager today.
Want to read more? Subscribe to the Blanchard Newsletter and get our tales from the vault, our favorite stories from around the world and the latest tangible assets news delivered to your inbox weekly.
The U.S. Dollar Is Only 51 Years Old: Could It Go to Zero?
Posted on — 1 CommentEarlier this year, legendary billionaire investor Charlie Munger – Warren Buffet’s right hand man – predicted the value of the fiat U.S. dollar would crash to zero within a century.
Could this happen? Consider this.
President Nixon severed the U.S. dollar’s convertibility to gold in 1971. That means the U.S. dollar in its current fiat form is only 51 years old.
It was around 550 BC that societies around the globe first used gold as currency. You do the math.
Fiat currency simply means that our U.S. dollar is not backed by a precious metal, or “hard money.” Instead, our U.S. dollar is backed by the full faith and credit of the U.S. government.
In 1971, the U.S. national debt was $398 billion. Today? The U.S. national debt has exploded to $30.9 trillion. That’s a lot of debt associated with our government and has a direct impact on the future value of the U.S. dollar.
Tie in the 40-year record-high inflation hitting Americans hard right now and you have a recipe for dollar disaster. “Inflation is a very serious subject, you could argue it is the way democracies die,” Munger told Yahoo Finance earlier this year, citing examples from the Roman Republic to Adolf Hitler to Latin America.
U.S. inflation is clearly not transitory as the Federal Reserve said for months as they dragged their heels on attacking the problem. Now, they are well behind the curve as inflation is out-of-control and “sticky” as economists like to say. Indeed, U.S. consumer inflation registered another red-hot 8.3% reading in August. “If you look at the underlying trend — I look at labor costs and rent increases — they both are pointing in the wrong direction and going up at hefty paces,” Sung Won Sohn, an economics professor at Loyola Marymount University and president of SS Economics, told CNN Business.
What does billionaire Charlie Munger think of all this? “I think the safe assumption for an investor is that over the next hundred years, the currency [U.S. dollar] is going to zero,” he told Yahoo Finance. “That is my working hypothesis.”
For investors’ today facing unprecedented market and economic conditions – decade high inflation, rising interest rates, slowing economy growth and a bear market in stocks – the risk/reward favors additional diversification into hard money or tangible assets like physical gold.
For thousands of years, gold has served as a medium of exchange, store of value and wealth preservation tool. While your dollar-based assets could crash as inflation and government debt eat away at the fiat currencies feasibility in the years ahead, gold will continue to grow in value.
Since 1971, gold has increased in value by 5,785% percent. One of the best things about gold? Gold has no counter-party risk. There is no bank, brokerage, government that is on the other side of your trade when you buy gold. Owning gold gives you the peace of mind of true ownership of a physical hard currency that can be exchanged for paper currency in any country in the world. You never have to worry that a bankruptcy or government default will cause your gold’s worth to go to zero – unlike a stock, a bond, or even the U.S. dollar.
Do you own enough gold? The time may be ripe to trade your dollars for gold.
Want to read more? Subscribe to the Blanchard Newsletter and get our tales from the vault, our favorite stories from around the world and the latest tangible assets news delivered to your inbox weekly.
5 Coin Hoards You Should Know About
Posted on — Leave a commentFor thousands of years humans buried, hid, and hoarded coins for a variety of reasons. In ancient times, people buried coin hoards during wartime to preserve and protect their wealth from enemy invaders. Today, there are still ancient coin hoards being found in the Mediterranean region dating back to 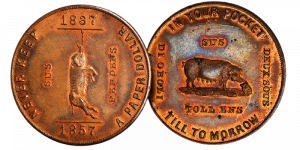 the Greek and Roman eras.
In early American life, people who distrusted banks or paper money hid their coins, preferring to store their life savings at home or in a nearby location.
People who buried coins generally planned to come back and retrieve the treasure, yet that wasn’t always possible – due to illness, death, or some other unforeseen circumstance.
Fast forward to today, and the discovery of a coin hoard is still an exciting numismatic event. It creates opportunity for collectors to obtain a rare coin, perhaps even in mint condition. Today we’ll explore the history and intrigue behind five famous coin hoards, starting with a recent hoard set to go to auction this October, to historical standouts.
But, be aware, the below list is just a drop in the bucket. There have been uncountable coin hoards throughout history – and who knows how many there remain to be found.
2019: UK Couple Discovers Rare Gold Coins During Kitchen Renovation.
After living in their North Yorkshire home for 10 years, a couple decided it was time to renovate their 18th century home. In July 2019, they discovered the surprise of a lifetime under their kitchen floor: over 260 gold coins dated from 1610 to 1727, which are now slated for auction in October and are valued at around $290,000.
The couple found the coins buried eight inches under their kitchen floor in a stoneware cup about the size of a soda can. It took several years before the couple could cash in on their coin hoard, as there was some legal back and forth with the British government, who ultimately decided the residents could keep the coins.
It is believed that these coins belonged to Joseph and Sarah Fernley-Maisters, who were married and lived in that home in 1694. The Maisters were an affluent mercantile trading family for two hundred years. However, their family line petered out after the couple died, which could be why the coins were never found.
2013: The Mystery Behind the Saddle Ridge Hoard
It was just about 10 years ago that the largest discovery of buried gold coins ever recorded in the United States was found in California. In 2013, a married couple walking their dog on their rural California property spotted a rust-covered metal can partially visible in the dirt. Upon further exploration, they unearthed the first gold coin of many. The 1,427 gold coins minted from 1847 to 1894 were valued at an incredible $10 million. Most of the coins were $20 gold pieces minted in San Francisco after 1854, during the gold rush period. The coins are in near perfect condition, which suggests they were never in circulation.
Today, no one knows who buried these gold coins or why. Most likely, a wealthy person who distrusted banks buried their coins there, but died before they could tell anyone where it is. We will likely never know the truth.
1996: The Wells-Fargo Hoard
This incredible hoard of 1908 “No Motto” $20 St. Gaudens gold Double Eagles was one that was hidden in plain sight! These coins were safely ensconced in a Nevada Wells Fargo Bank vault – and were discovered in original condition and apparently untouched since 1917. Official records reveal that these gold coins were intended for a World War I debt payment, but apparently were long forgotten deep in a bank vault corner for over 80 years.
The Wells Fargo hoard is remembered not only for its size, but also for the outstanding condition of the coins that were found: all coins were Mint State. These $20 St. Gaudens were offered on the market and sold between 1997 and 1999.
1951: The Binion Hoard
The story behind the Binion hoard has all the ingredients for a TV docudrama – yet is was a real-life story: a gambler, a stripper at a Las Vegas club, a love triangle and ultimately murder. We’ll let you watch the Court TV documentary for all the gory details. Here are the basics.
Ted Binion was the youngest son of casino tycoon Ben Binion, who opened the Binion’s Horseshoe Casino in Las Vegas in 1951. Son Ted grew up working different jobs at his father’s casino and was well-respected for his gambling acumen. Later in life, however, he began associating with a rough crowd, which ultimately led to the loss of his casino license and to nefarious circumstances surrounding his death. In the wake of Ted’s passing in 1998, law enforcement officials discovered a 12-foot deep vault on his property in Pahrump, Nevada, which held roughly $7 million in treasure including over 100,000 Morgan and Peace silver dollars.
For collectors, this opened the door for a once in a lifetime chance to obtain rare silver coins with a dramatic story behind them.
1888: Aaron White Hoard
The last hoard we will discuss today was built by Aaron White. He was a Connecticut attorney, who worried that the financial strain of the Civil War could bankrupt our country and that all government-issued paper money would become worthless with no value.
To protect against such dire circumstances, White hoarded hard money (gold and silver coins) – like many other Americans did during that era. He famously struck his own token with the words on it: “Never Keep a Paper Dollar In Your Pocket ‘Till Tomorrow.”
White saved over 100,000 gold and silver coins. After his death, the hoard was found to include 350 gold and 100 silver dollars, 200 silver half dollars, 5,000 2-cent pieces, 60,000 large cents and 60,000 copper-nickel cents, 250 Colonials, and more than 20,000 foreign coins. The White coin hoard was sold privately, yet scandal rocked the sale preview, as thieves stole important coins.
Even today, people still hoard coins. And, anyone could experience the thrilling discovery of finding a coin hoard.
Want to read more? Subscribe to the Blanchard Newsletter and get our tales from the vault, our favorite stories from around the world and the latest tangible assets news delivered to your inbox weekly.
How California Fractional Gold Built the West
Posted on — Leave a commentThe California gold rush became an industry of its own soon after the discovery of gold in the American west. Like any industry, the gold rush needed a system of trade. Developing such a system required the creation of California fractional gold. Some believe that before the creation of California fractional gold people would make daily purchases with a pinch of gold dust. It wasn’t long before those traveling west realized that a better system was needed.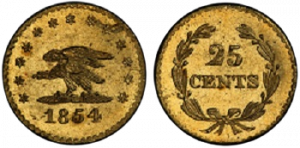
Pioneers and others needed coins of small denominations. These smaller value coins were necessary for executing the daily sale and the purchase of everyday items. Between 1849 and 1856, various assayers minted gold coins in values of $0.25, $0.50, $1, $5, $10, $20, $25, and $50. It is likely that the majority of minters were jewelers who had experience working with small pieces of metal.
These pieces were not recognized as government-issued legal tender because they were minted independently. Therefore, while commonly referred to as coins, they are, strictly speaking, more accurately classified as “coin-like ingots.” Those pieces that are non-denominated are referred to as “tokens.”
California gold coins were a solution to the challenge of using silver coins for trade in the west. Many of these silver pieces were foreign which made them impractical. There were many varieties and often the intrinsic value of the coin was worth less than their trading value.
Today, there are 450 known California gold coin varieties. Many of these have no mint marking or are marked only with a set of initials, and are round or octagonal. Despite the anonymity of these coins, many believe that the majority were minted in San Francisco, and Leavenworth, Kansas. The process of making the coins was imprecise because they were minted without the industrial equipment found in the east coast mints of the US at that time. Assayers used the hammer method. This was a crude, but effective approach in which the minter simply used a sledgehammer to strike the die into the blank coin.
Many of these coins are highly sought after among collectors. In 2021, one collector holding 124 different varieties of California fractional gold sold his entire set. Among these varieties was the Defiant Eagle $0.25 coin minted in 1854. The highest recorded auction of this coin is $59,800 earned in 2009.
By 1864 the US government decided to make the practice of producing coins like these illegal with the passage of the Coinage Act.
For many collectors, the allure of the coins is not only their rarity but the industrious spirit they represent. The coins are an example of how the American west was developed by people, as much as it was the government. California fractional gold coins enabled the emerging economy that gave rise to what are some of the biggest economies in the world today. Moreover, these pieces were the currency of the “everyman” rather than the wealthy elite. They were used for basic purchases that were part of everyday life.
Want to read more? Subscribe to the Blanchard Newsletter and get our tales from the vault, our favorite stories from around the world and the latest tangible assets news delivered to your inbox weekly.
Gold and The Golden Years
Posted on — Leave a commentRetirement, like a mirage on the horizon, is an oasis many will never drink from.
More Americans are learning that retirement is less feasible than they thought. There are many causes of this evaporating dream.
Consider that wages have stagnated for over thirty years. This is likely due, in part, to the fact that almost half of Americans of working age (18-64) earn a median annual wage of less than $20,000 according to research compiled by Brookings Institute.
Additional research from the Economic Policy Institute (EPI) adds dimension to this picture. Researchers learned that the portion of all US families with retirement savings has decreased since the onset of the Great Recession. The EPI’s conclusion is definitive and clear: “most families—even those approaching retirement—have little or no retirement savings.”
This trend comes at a time when the cost of living is rising considerably. While inflation has moderated slightly in recent weeks, it is clear that many resources remain lower than they did before the pandemic. The result is elevated costs associated with everyday necessities, particularly gas and food. Meanwhile, retirees face other rising costs, like healthcare, which increase as individuals reach old age. Research from Fidelity estimates that a 65-year-old couple in the US should expect to pay $275,000 in out-of-pocket healthcare costs post retirement.
These headwinds have compounded the difficulties brought on by the Great Recession which resulted in falling 401K plan participation, and the long-term erosion of pension plans.
The confluence of these factors means that “retirement inequality is greater than income inequality even in peak earning years,” according to the EPI study. Moreover, this problem comes at a time when a record number of Americans are entering retirement. The pandemic likely accelerated Boomer’s movement into their golden years. Approximately six months after the start of the pandemic, 40% of all baby boomers were retired and the total number of boomers entering retirement each year since has increased.
Investors facing retirement are considering ways in which they might make up the shortfall through a better asset allocation in their portfolios. Gold is one answer for three reasons.
First, gold offers the possibility for capital appreciation that is not subject to the whims of the equity and bond market. This independence is important, as more equities begin to rise in fall in unison which undermines the intent of a diversified mix of holdings.
Second, gold offers freedom from counterparty risk which is the risk that another party connected to one’s investment fails to act in the investor’s best interest. Unfortunately, investors experienced the outcome of this risk during fiascos like the Enron scandal and the subprime housing collapse.
Third, gold has a history of providing a safe haven during periods of equity market turmoil. As 2022 moves to a close many investors have seen their savings shrink as the broader markets have succumbed to the effects of the Ukraine war, inflation, and economic uncertainty surrounding the prospect of a recession.
The looming retirement crises will not be solved by a single solution. But savvy investors can make moves today that provide a degree of protection.
Want to read more? Subscribe to the Blanchard Newsletter and get our tales from the vault, our favorite stories from around the world and the latest tangible assets news delivered to your inbox weekly.
How Gold Ownership Helps You Control Risk
Posted on — Leave a commentBeing a Navy SEAL and sniper taught me all about risk management. Take away all the risk variables under your control and reduce it to an acceptable level. – Brandon Webb
There are many things you can’t control in your life – the weather, the traffic, the economy, government policies to name a few.
When it comes to investing there is a simple strategy you can control – one that can ultimately protect and grow your wealth.
What is this strategy? Successful investors control their risk.
In finance, there is a relationship between risk and return. In theory, if you are willing to take on greater risk, there is the potential for a bigger return. But, risk also includes the potential to lose some or all of your investment.
Another condition involved in risk – is how readily available your money is to you. Is it liquid, can you access it fast if you need it? An example of an illiquid investment is real estate. It can take months to sell your asset and get access to your money when you need it.
The stock market is defined as a risky asset and one that involves significant volatility. Stocks can lose some or even all of their value if market conditions go south. Yet, investors are willing to take on that stock market risk in hopes of gaining a larger return than from a bond or CD.
When you look at your portfolio – ask yourself – what does a big decline in my investments mean for you, like the one stock investors experienced in 2022?
The stock market fell over 20% earlier this year and many individual stocks and cryptocurrencies registered much bigger losses. We are now heading into an investing cycle where stocks could dramatically under-perform in the years ahead amid weakening economic growth, rising interest rates, accelerated inflation and record levels of government debt.
Are you taking on too much risk? This is a great time to review your portfolio and make changes to help get you on track.
In the investing world, you can reduce your risk dramatically through diversification. Allocating up to 10 or 15% of your portfolio, based on your personal risk tolerance level, to gold can add stability to your portfolio and reduce your risk. Gold ownership diversifies your portfolio and reduces your risk because it has a negative correlation to stocks. That means while stocks go down, gold typically rises in price. Owning gold helps you control your portfolio risk.
Another advantage of gold is that it is a very liquid asset. Gold is money. Gold can be easily transported anywhere in the world and traded in for paper money. Every country on earth recognizes gold as money.
Indeed, gold is the fourth most liquid investment in the world, according to World Gold Council data. That means you can sell it the same day for paper money if you need to. Access to your money via gold in a crisis, market stress or simply anytime you want it – is one of gold’s prized characteristics.
As the Navy Seal said at the start of this article, risk management includes removing all the variables under your control. Are you too heavily invested in risky assets like stocks? Could you control your risk more effectively by increasing your allocation to gold? If you would like a personalized consultation on how much gold ownership could be appropriate for you, call a Blanchard Portfolio Manager today.
Want to read more? Subscribe to the Blanchard Newsletter and get our tales from the vault, our favorite stories from around the world and the latest tangible assets news delivered to your inbox weekly.


