


Numismatic Boom Cycle Remains Strong in 2022
Posted on — 2 CommentsWhile Bitcoin plunged 48% over the past four months, the numismatic market remains strong at the start of 2022 – extending its incredible run over the past two years.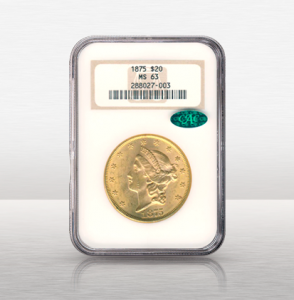
The start of the current boom in rare coin prices can be traced to the beginning of the pandemic in 2020, which triggered a renewed interest in tangible assets like rare coins. Both the number of sales of rare coins and the prices paid for rarities exploded higher over the past two years industry-wide. At Blanchard, we saw stunning demand from new clients and long-time clients who had been inactive in numismatics for a period of time.
A Return to “Real” Assets
Looking back, the unsettling financial market volatility in 2020 reignited investor interest in real and tangible assets. You may recall, between February 12, and March 23, 2020 the Dow lost a stunning 37% of its value and the crude oil marked tanked – briefly trading below $0/barrel.
The chaos in the financial markets during the pandemic renewed investor appetite for tangible assets like rare coins that you can see, hold, and pass on physically and privately to your heirs. Rare coins and gold hold a distinct advantage over cryptocurrency, and even stocks, in that they have thousands of years of history of preserving wealth. With the stock market at extended highs and showing increased volatility now, many of our clients are taking profits on their stock positions and rolling those funds into their rare coin portfolio.
Rare Coin Prices Climb in an Uptrend
The prices of key rare coins soared 16% versus year-ago levels, according to an industry index created by the Professional Coin Grading Services (PCGS). Perhaps even more impressive, the key rare coin price index shows a 6,315% increase since it was created in 1970, underscoring the wealth appreciation aspect of long-term numismatic investing. As Blanchard’s Sales Manager, Ed Wehrman, says, “have you seen the number of all-time highs in ultra-rarities making the headlines?”
2022 Rare Coin Market Remains Tight
As we enter 2022, demand for rare coins remains extremely high, while supply is the tightest level seen in decades. The pace of rare coin sales is brisk and high-quality rarities move nearly instantly once they become available.
David Zanca, Senior Portfolio Manager at Blanchard, describes current rare coin market conditions: “Prior to the pandemic I would have availability on as many as 500 rare coins. Today, that number is closer to 30 or 40 coins. Recently, we have begun to see more pieces come available. But, every rare coin that we source is either pre-sold or is placed in a matter of minutes of hitting the market.”
“On a recent Friday afternoon six rarities became available, averaging in the neighborhood of $150,000 per piece. Every single piece was placed by noon the next day – Saturday,” Zanca said. At Blanchard, many rare coin investors take a long-term approach, typical across the country today – which is contributing to the tight rare coin supply conditions. “I offered a client nearly $500,000 cash on the spot for a coin that represented a nearly 40% profit and they wouldn’t consider selling,” Zanca said.
Indeed, the demand from well-positioned rare coin investors has been unrelenting, as both high-net worth and mom and pop investors implement a strategic shift from paper assets into hard assets with the focus on preservation of wealth.
Two Hallmark Placements
Despite the tight numismatic market supply, Blanchard has been very successful in unearthing several private holdings. Blanchard’s ability to source and place hallmark coins underscores our on-going commitment to quality and deep roots in the numismatic market nationwide.
Blanchard recently placed two flagship rarities including the 1794 Flowing Hair Dollar and the 1808 $2½ Capped Bust Quarter Eagle. Given the tiny mintage and the concentration of wealth in the United States in that era, these hallmark coins could very well have been owned by one of the American greats of that time.
Numismatists call the 1808 $2.50 Capped Bust a “stopper coin.” (Stoppers are the coins that have historically presented the greatest difficulty in completing a set.) From the day this Quarter Eagle was minted it was a rarity, with only 2,710 coins produced. The vast majority were melted and no longer exist. The few collectors who are fortunate to own this 1808 Quarter Eagle have the most sought-after coin to complete their set, as it can be many years before a coin like this even emerges onto the market for sale.
Another coin Blanchard recently placed: the 1794 Flowing Hair Dollar was the first dollar coin issued by the newly established United States federal government and represents the beginning of the American monetary system. When Blanchard recently placed this coin with a collector they became not only an investor, but a preserver of American history and safe keeper of the beginning of our nation’s monetary system. These legacy investments not only preserve and increase wealth, but also preserve and honor United States history.
Given current market conditions, Ed Wehrman advises, “get started now. Talk with your Blanchard portfolio manager and create an acquisition plan.” Rare coin investors who have a plan in place are well positioned to acquire high quality and tremendous investment pieces.
Want to read more? Subscribe to the Blanchard Newsletter and get our tales from the vault, our favorite stories from around the world and the latest tangible assets news delivered to your inbox weekly.
The 1954 Franklin Half Dollar
Posted on — Leave a commentThe Franklin Half Dollar carries a sense of irony with it. The very person it depicts, Ben Franklin, would have likely objected to the idea of his profile on a piece of currency. He was accustomed to seeing living royalty on coins and he certainly did not see himself as a royal figure.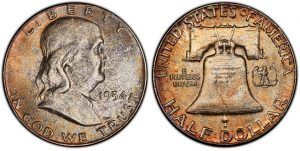
Moreover, the small image of an eagle on the reverse would have angered him. He saw the eagle as a weak image given their tendency to scavenge. Franklin’s choice for the national bird was a turkey.
The coin was originally conceived in 1947 when Mint Director Nellie Tayloe Ross requested a design featuring Franklin. Sadly, the designer died that same year leaving the reverse imagery incomplete. Soon after, new chief engraver Gilroy Roberts took over and eventually added the small eagle as an unplanned extra flourish. As it happened, this addition was, in fact, required because the Coinage Act of 1873 mandated that any coin with a value greater than a dime must include the eagle.
The main image on the reverse depicts the Liberty Bell. This aspect of the design worried some at the Commission of Fine Arts who feared the crack might invite comparisons to faults within the nation as a whole. As a result, the Commission disapproved the design. In place of the existing images the Commission suggested hosting a design competition in which submitted works would be reviewed by those in the Commission. This idea was rejected by the Treasury Department. Ultimately, Treasury Secretary John W. Snyder approved the design.
The official release date of the coins was set for April 30th, 1948 to coincide with the anniversary of George Washington’s 1789 inauguration as President. The coin was minted in small quantities in the initial release due to an abundance of Walking Liberty half dollars in circulation.
Today, the coin is a popular entry point for those starting a collection because there are only 35 different dates and mintmarks in the series. As a result, it is relatively inexpensive to collect the entire set.
One particular piece that stands out is the 1955 “Bugs Bunny” minting. The coin earned this name after an obverse die and a reverse die clashed causing the profile of Franklin to appear as though it had buck teeth. The error is small and only visible under close inspection.
Over the years officials made some minor revisions to the design. For example, in 1958 and 1959 the number of long tail feathers on the eagle were changed.
The coin consists of 90% silver, and 10% copper. While many pieces were minted the coin has also been submitted for melting in large quantities due to the value of its silver content. The US Mint issued the coin through 1963.
The Franklin Half Dollar is a reminder that historical figures are sometimes memorialized in ways that are always in line with the preferences of the person being honored. While collectors have long valued the coin and the skill of the designers it is likely that Franklin would have found the entire project ironic.
Want to read more? Subscribe to the Blanchard Newsletter and get our tales from the vault, our favorite stories from around the world and the latest tangible assets news delivered to your inbox weekly.
The Super Bowl Indicator and Stocks
Posted on — Leave a commentAre you making your Super Bowl plans now? While the clock is running down until game time, market historians remind us that the winner of the Super Bowl could offer clues  on how the stock market will perform in 2022.
Really?
New York Times sportswriter Leonard Koppett developed the Super Bowl Indicator back in 1978. While at first this was a cheeky little theory, it has surprisingly shown teeth over the past 44 years, with a fairly impressive accuracy rate. What is this rule? Huddle up.
The Super Bowl Indicator states that the Dow Jones Industrial Average will close out the year with a positive return if the team from the National Football Conference (NFC) – or one with original NFC roots – wins the Super Bowl. On the flip side, this indicator warns that the DJIA will record losses at year-end if the American Football Conference (AFC) team wins the big game.
Looking back throughout history, from 1967-2015, the Super Bowl indicator reveals an accuracy rate of 82%. That is, indeed, better than a coin flip.
While this may be a fun statistic, Wall Street experts explain there is no real connection between who wins the Super Bowl and stock market performance.
At the crux of the matter is a simple rule: correlation does not equal causation.
Sorry to disappoint, but the Super Bowl Indicator’s past performance is simply a coincidence. Indeed, if the stock market ends the year with a loss and the Cincinnati Bengals take home the trophy on Sunday, it would be pure coincidence.
For you, as an investor, it is correlation that truly matters. And, in diversification – non-correlated assets – like physical gold – are one way you can protect your blind side.
Gold’s lack of correlation to other assets is one of its strengths in your portfolio. No- or low-correlation means, for example, that when stocks crash, gold typically climbs.
For optimal risk-adjusted performance, the traditional 60% stocks – 40% bond portfolio should be set instead at 60% stocks, 5% bonds and 35% gold, according to GraniteShares’ research. Annualized portfolio returns increased when gold was added to the portfolio.
Last month’s January stock market losses revealed how vulnerable equities are to getting sacked.
It may be time to bolster your defensive package. It’s still the first down of the year when it comes to your portfolio. There’s still time to round out your bench with diversification that is statistically significant – like increasing your allocation to physical gold.
Want to read more? Subscribe to the Blanchard Newsletter and get our tales from the vault, our favorite stories from around the world and the latest tangible assets news delivered to your inbox weekly.
An Important Investing Quote for These Turbulent Times
Posted on — Leave a commentInflation at 39-year highs. Stocks in correction territory. Fears about Russian military action into Ukraine. Federal Reserve rate hikes. Pick your poison. Financial markets are unraveling fast and there is panic and fear running wild on Wall Street.
After three years of S&P 500 gains in the 18-31% area (historically abnormal, by the way), the stock market is returning to reality. The worst performing stocks in 2022 are already down almost 90%. Here’s a list.
TDH Holdings -89.42%
Astro Aerospace -88.89%
Aligos Therapeutics -76.15%
Vantage Health -63.41%
Gex Management -63.33%
The tech-heavy NASDAQ composite index shed an incredible 13.5% as of late January – and the month isn’t even over yet. The S&P 500 has traded as much as down 10% for the year.
The consensus on Wall Street is that stock market losses will likely get worse before they get better – with overall S&P 500 declines stretching as much as down 20%. Are you ready for what lies ahead?
That brings us to an important quote for our times. As the famous investor Peter Lynch said: “Know what you own, and why you own it.”
One of the essential principals of successful investing is diversification – across non-correlated assets. Gold is a non-correlated asset to the equity markets, which is the key characteristic that makes it so valuable to investors looking to diversify their portfolios and protect their wealth.
Demand for gold already picked up this week as fears over military conflict between Russia and Ukraine flared. Historically, investors flock to gold during geopolitical conflict as the yellow metal performs as a safe-haven investment and holds its value when other asset classes fall.
With inflation running near 40-year highs at 7%, the value of gold is easy to see. Over the last 50 years gold has provided an average annual real return of 12.7% when US CPI exceeded 5%, compared to negative returns on average for both US equities and bonds, according to State Street Global Advisors.
Indeed, a January 25 Wall Street Journal article stated: “One asset holding up through the early 2022 market turmoil: gold. Rising geopolitical tensions in Europe and a slide in major U.S. stock indexes has sent investors rushing into the haven metal.”
Experts agree. The historic low liquidity period is ending. The Federal Reserve is going to pull back on some of its easy monetary policies that have supported the stock market’s recent rise. As the Fed pulls the easy money rug away and the stock market crumbles further in the face of raging inflation, investors who own gold will sleep better at night knowing that a portion of their wealth isn’t simply disappearing as equity prices collapse.
What do you own now in your portfolio? And, as legendary investor Peter Lynch said, do you know why you own it?
Want to read more? Subscribe to the Blanchard Newsletter and get our tales from the vault, our favorite stories from around the world and the latest tangible assets news delivered to your inbox weekly.
Bracing For Impact: What’s Next for Investors
Posted on — Leave a commentInvestors are being tested. Equities are down significantly for the year and 2022 has only just begun. High-risk speculative assets like crypto have performed even worse.
Meanwhile, inflation threatens “side line” money that investors are holding, as they wait to see how far the market will drop. As interest rate hikes loom there seem to be fewer places to invest. For most the goal has shifted from earning a decent return to merely preserving capital or minimizing losses. This chilly start to the year has many investors worried about what they’re in for over the next 11 months. Many are asking if gold can counterbalance some of the new risk that has crept into so many portfolios?
An analysis from the World Gold Council offers some answers.
Their research concluded that “adding between 4% and 15% in gold to hypothetical average portfolios over the past decade, depending on the composition and the region, would have increased risk-adjusted returns.”
The same report shows how many structural changes have buoyed the performance of gold in recent decades. For example, emerging market growth – like that seen in India and China – have broadened the group of people able to buy gold. Additionally, an increase in central bank demand has boosted gold’s performance as more nations rely on the metal in their reserves. Finally, the global financial crisis has alerted more investors to the importance of gold as a strategic asset to offset risk.
These benefits might lead one to ask why gold has not become a mainstay in retail investor portfolios. The answer might be the mania surrounding equities in recent years.
In 2015, 2017, 2019, and 2020 large cap growth stocks were the highest performing asset class. This pattern has attracted millions of investors. The problem: the music has stopped.
While 2022 is still young it seems unlikely that the high performance of growth will continue. Valuations remain high. Meeting those expectations will require even greater profits amid a backdrop of supply chain challenges.
Simultaneously, the fervor around tech stocks has fallen as recent earnings reports have disappointed. This underperformance has prompted concern because so much of the growth propelling indexes like the S&P 500 is supported by a few tech heavyweights. The five highest performing stocks have massively outpaced all others in the index. Those top five have returned 25.6% annualized over the past five years. In comparison the other 495 stocks have delivered an annualized 6.5% return over the same period. Most of these five stocks are found within the FAANG group consisting of Facebook, Amazon, Apple, Netflix, and Google.
Gold offers an degree of diversification that is disappearing from indexes. Consider that over the last half century “the price of gold in US dollars has increased by an average of nearly 11% per year since 1971,” according to the same body of research from the World Gold Council. Over the last five years gold has outperformed commodities, cash, US bonds, hedge funds, and global bonds.
Early signs of the year ahead has given investors reason to rethink their strategy and consider gold.
Want to read more? Subscribe to the Blanchard Newsletter and get our tales from the vault, our favorite stories from around the world and the latest tangible assets news delivered to your inbox weekly.
Man vs Machine: Investing in Today’s World
Posted on — Leave a comment Investors increasingly face an unseen opponent: technology. Often investors believe that technology empowers them. It enables mobile trading. It delivers endless data. What few realize is that technology works against them in many ways.
Consider that high-frequency trading (HFT) accounts for 70 percent of all equities trading, and that, “fundamental discretionary traders” – people who log in and make a trade like an ordinary human – only account for about 10 percent of all trades according to research from JPMorgan. Market movements have more to do with machines than man.
It’s not surprising to hear the global head of quantitative and derivatives research at JPMorgan warn that, “big data strategies are increasingly challenging traditional fundamental investing and will be a catalyst for changes in the years to come.”
This aspect of equity investing means that an investor’s success is less dependent on their strategy or the intrinsic value of the companies they hold. Instead, the value of their equity portfolio – especially those with short time horizons – are influenced, in part, by HFT activity.
This begs the question; how do investors regain control over their investment performance? For many the answer is gold, and research explains why.
Researcher Joerg Picard wanted to understand how trading influences the value of gold. He reviewed market data and learned that ETF gold trades, which can be traded as easily as HFT equities, “do not contribute much to price discovery.” This conclusion should be reassuring to investors seeking a strategy that is not at the whim of algorithmic trading.
This benefit is especially important in a setting where other influences threaten investment. Inflation is one such threat to the spending power of capital gains. The executive director of precious metals research at Standard Chartered Bank explains that “Various studies have shown us that if gold is held for 12 to 18 months before inflation takes higher and then it’s held for an additional 12 to 18 months while inflation moves higher, it can be a good inflation hedge.”
This assessment underscores an important characteristic of gold; it often serves as a stabilizing force in a portfolio. More investors are seeking this kind of assurance as more uncertainty creeps into the markets. Inflation fears are persistent, and at the same time COVID continues to take its toll on the global supply chain, and geopolitical tensions are on the rise as Putin threatens to make aggressive moves against Ukraine. These reasons might explain why so many analysts are forecasting tepid equity gains for 2022.
Investors have an opportunity to regain control of their portfolio as the pervasiveness of HFT continues to exact influence over the market. As competing investment managers develop more technology in the arms race for a higher return ordinary retail investors face growing challenges. Consider including gold into your asset allocation plan.
Want to read more? Subscribe to the Blanchard Newsletter and get our tales from the vault, our favorite stories from around the world and the latest tangible assets news delivered to your inbox weekly.
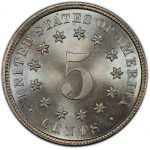
How the Shield Nickel Rebuilt U.S. Currency
Posted on — Leave a commentThe chaos of the Civil War decimated U.S. currency. As a result, many people resorted to merchant tokens, encased stamps, and fractional currency. When the war ended, officials faced the daunting task of reissuing coinage.
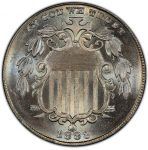
By 1864, Congress authorized the minting of a five-cent coin. It was not long after that things started to go wrong. It was decided that the coin would bear the image of “Clark.” By this officials meant the iconic explorer William Clark. However, officials later saw that this plan was misunderstood and that the design featured Spencer M. Clark who was then the head of the Currency Bureau.
This mistake, while funny, caused an uproar. The response to the error was swift. Congress immediately passed a law which forbade the issuance of any coin with the image of any living person.
Meanwhile, industrialist Joseph Wharton was continuing to exert his influence on Congress. Wharton was close to having a monopoly on the mining of nickel in the US. Therefore, he saw an opportunity to advocate for coins consisting of the metal. To accomplish this, he leveraged his connection to officials in Congress. By May of 1866, a bill passed which provided for a five cent coin consisting of 75% copper, and 25% nickel.
The work of designing the piece was handed to Mint’s chief engraver, James B. Longacre. In the interest of meeting a looming deadline, Longacre borrowed elements from the two-cent coin he designed. He took the shield appearing on the two-cent piece and applied it to the five-cent coin. This shield provided the coin with a bold look signifying defense and strength in the unity of a recently divided nation.
The top portion of the shield represents Congress, while the 13 vertical stripes represent the states. The crossed arrows at the bottom of the shield symbolize non-aggression with a willingness to attack if provoked.
Despite the dramatic look of the pieces, the design received widespread criticism. Many felt that the shield had the feel of a tombstone rather than a symbol of self reliance. Moreover, some of the design elements caused production problems. The dies used to mint the pieces had short life spans due to the hardness of the planchet. By 1867, officials had simplified the piece by removing the rays surrounding the “5” on the reverse.
By 1869 production of the coins dropped due to enough reaching circulation. In time they became known simply as “nickels.”
Many varieties of the coin remain today because the dies had to be replaced so often. Mint officials built these replacement dies fast, often leading to inconsistencies. The 1868 coin, in particular, has many errors. There are more than sixty different double die varieties caused by misalignment. Additionally, the 1873 piece has a variety known as the “closed 3” piece because the 3 in 1873 occasionally resembles an 8.
In 1883/2, the final year of production, some coins received a double date in error. As a result there was a 2 under the 3 in the date of some coins. This was due to the Mint’s decision to reuse the 1882 die and simply adjust the last number.
Despite the rocky history of the shield nickel this coin is the reason we refer to five-cents as nickels. The piece is a reminder that the work of rebuilding a nation touches on every conceivable aspect of life.
Want to read more? Subscribe to the Blanchard Newsletter and get our tales from the vault, our favorite stories from around the world and the latest tangible assets news delivered to your inbox weekly.
A Brief History of U.S. Inflation
Posted on — Leave a commentYou may have seen the inflation news this week. The U.S. consumer price index (CPI) climbed to 7% in December, its highest level since 1982. That marks the third month in a row with inflation above 6%.
This is a direct contradiction to the Federal Reserve’s prediction that “inflation would be transitory.”
The inflation we are seeing today is the worst in 39 years. But it’s not hyperinflation. At least, not yet anyway.
When we talk about hyperinflation we often think of third world economies. Countries like Venezuela, Zimbabwe, and even Lebanon and Yugoslavia suffered from hyperinflation in recent years.
Could hyperinflation happen here in the U.S.? It may surprise you to learn that it already has.
The U.S. suffered three periods of hyperinflation in the 20th century, according to a Jan. 10 Barron’s article Whip Inflation Now? Good Luck With That.
When did these occur? The first two hyperinflation periods followed each of the world wars, and then there was the Great Inflation of the 1970’s.
After the First World War, U.S. soldiers returning home discovered consumer prices 80% higher than when they left, Barron’s reported. Soon after, our country fell into a depression. During World War II, President Franklin Roosevelt wanted to prevent that from happening again. The government enacted price controls or “caps” on many items like shoes, gasoline, coffee and meat. The CPI dropped from 10.9% in 1942 to 6% and then 1.6% and 2.3% in the three following years. However, once the price controls were removed, consumer prices soared higher, with food costs doubling by August 1948.
Two decades later the so-called Great Inflation period in the U.S. began. The U.S. CPI skyrocketed 186% from 1968 to 1983.
What caused the Great Inflation you may ask? Federal Reserve polices that allowed for an excessive growth in the money supply.
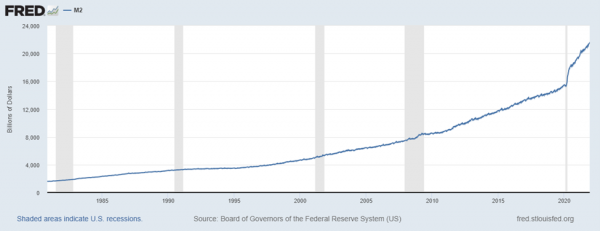
That’s exactly what we are seeing now. This chart reveals the growth of the M2 money supply. Notice the dramatic spike higher since 2020. The Fed already got “transitory” inflation wrong. Are they making another mistake with their expansive money supply policies?
While it’s thought the Federal Reserve does have the tools to fight inflation – raising interest rates – the cure can often be as troubling as the disease. Historically, fights against inflation have led to painful recessions and high interest rates.
When then Fed Chairman Paul Volcker attacked inflation at the tail end of the Great Inflation, interest rates soared to 19% in 1981 after inflation touched 14.8% in 1980.
The current macroeconomic conditions are unlike anything we have seen in decades. But, unfortunately, we can learn from history and remember that high inflation usually leads to painful recessions and stock market volatility.
If you are wondering what you can do, consider the history that gold has as a store of value. While your dollar’s purchasing power is declining as inflation rises, gold has been relied upon for a store of value for at least 5,000 years.
That’s a track record you can count on in these uncertain times. Do you own enough?
Want to read more? Subscribe to the Blanchard Newsletter and get our tales from the vault, our favorite stories from around the world and the latest tangible assets news delivered to your inbox weekly.
The Father of Our Country
Posted on — Leave a commentGeorge Washington led our nation through some of its most trying times. Born into a prosperous planting family in Virginia in 1732, Washington was named commander of the Virginia militia in 1752 and fought in the French and Indian war.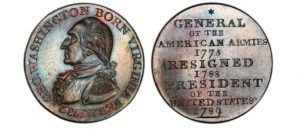
As the British kept raising taxes on the American colonists, by the late 1760’s, Washington believed it would be best to declare independence from England.
In 1774, he served as delegate to the First Continental Congress. A year later as the American Revolution broke out, he was named commander in chief of the Continental Army.
Washington was known as a man of high integrity and an inspirational leader. While the struggling colonial army had little of the supplies, clothing and food that the British had – they had their leader.
During the difficult winter of 1777-1778, Washington’s motivating leadership at Valley Forge kept the candle of hope lit among his troops. By 1781, the Continental forces captured British troops in the famed Battle of Yorktown, which essentially ended the Revolutionary War.
Washington quickly became a national hero. Many Americans wanted a piece of their hero – and coins, medals and tokens were minted from 1783 through 1795 to honor this man.
Known as Washington Pieces, early Americans collected these tokens, many of which were minted overseas. All of the pieces featured and honored George Washington. Collectors today still covet coins from this category and there are over a dozen different types available.
As America’s first president, Washington provided a guidepost as to what our own experiment in democracy could create and his legacy still guides us today. A compassionate man, he advised: “Let your heart feel for the afflictions and distress of everyone.”
As a reasonable man, Washington also warned that “We must consult our means rather than our wishes.”
In a particularly prescient quote, Washington foreshadowed the development of the European Union 200 years before it was created: “Someday, following the example of the United States of America, there will be a United States of Europe.”
Washington also provided a warning on the dangers of political parties to future generations:
“However [political parties] may now and then answer popular ends, they are likely in the course of time and things, to become potent engines, by which cunning, ambitious, and unprincipled men will be enabled to subvert the power of the people and to usurp for themselves the reins of government, destroying afterwards the very engines which have lifted them to unjust dominion.”
While George Washington was a great leader for our nation, in the end he loved working on his farm – Mount Vernon. He grew Mount Vernon from a 2,000 acres farm into an 8,000-acre operation that included five farms. Washington grew many crops, including wheat and corn, he bred mules and maintained fruit orchards and a fishery.
He is known for saying: “I had rather be on my farm than be emperor of the world.”
Last but not least, Washington had an opinion on paper money that we use today:
“Paper money has had the effect in your state that it will ever have, to ruin commerce, oppress the honest, and open the door to every species of fraud and injustice.”
Washington pieces include tokens like the 1783 copper GEORGIVS TRIUMPHO. Also dated 1783 (even though they were coined later) are the Small Bust, Draped Bust and ‘UNITY’ Washington tokens which feature a left-facing bust of Washington wearing a military jacket. Extremely popular among collectors are the 1791 Washington copper cents, which carry a ONE CENT denomination. These coins feature a bust of Washington also dressed in a military jacket.
Want to read more? Subscribe to the Blanchard Newsletter and get our tales from the vault, our favorite stories from around the world and the latest tangible assets news delivered to your inbox weekly.
Silver Demand Running Hot
Posted on — 1 CommentEveryone wants silver these days. That includes investors just like you who want to diversify their portfolios and manufacturers of everything from health care items to lithium batteries to solar panels and more.

In 2021, every key area of silver demand rose – including the total for overall demand at 1.029 billion ounces, according to the Silver Institute.
Investors, including family offices who want to buy silver bars for their wealthy clients, high-net worth individuals and mom and pop investors all bought more silver in 2021. Indeed, investment in physical silver jumped 32% in 2021 to a 6-year high, according to Philip Newman, managing director at Metals Focus.
On the manufacturing side, the great silver industrial boom is just beginning. As scientists discover more applications for silver in industry every day – industrial demand is red hot and going straight up for the white metal.
Here’s a quick look at two new silver industrial applications:
First, the U.S. Food and Drug Administration approved a new wound dressing product for use in our Strategic National Stockpile that contains silver. Argentum Medical’s Silverlon silver-based wound dressing contains 50 to 100 times more metallic silver ions than other silver- impregnated dressings and is approved for an application up to seven days for patients who have skin injuries due to radiation treatments.
Second, scientists have now discovered that silver can help fix the short-comings of lithium batteries, which power electric cars. After many charges, lithium batteries tend to short circuit internally, which can destroy the battery. Scientists discovered that adding a silver-lithium layer at the battery’s anode holds back the development of lithium filaments, and forms a stable interface with the solid electrolytes. This improved capacity retention by 94.3% over 140 battery cycle, scientists documented in the journal Advanced Science.
The Supply Demand Balance Is Shifting
In 2021, the overall silver supply including mine production, recycling, and official sector sales increased by 5% from 2020. Yet, total silver demand, which includes industrial uses, photography, jewelry, silverware, physical investment, and hedging demand increased by 15%!
That spells higher prices ahead.
Where Is Silver Now?
In December 2021, silver was trading at $22.97 per ounce, an 89% increase over its 2020 low of $12.13. If silver climbs to $35 an ounce, that will mark a 52% gain over 2021 end of year prices.
If you are concerned about inflation now at a 39-year high, the uncontrolled fiscal expansion we are seeing in our government, and the negative interest rates you are getting on your bond returns, increasing your allocation to physical silver could be the right more for you.
This is an optimal time to add precious metals to your portfolio. Demand for silver is running hot and the supply/demand equation will soon force silver prices higher. If you have questions about the outlook for silver prices ahead, call and speak with a Blanchard portfolio manager today!
Want to read more? Subscribe to the Blanchard Newsletter and get our tales from the vault, our favorite stories from around the world and the latest tangible assets news delivered to your inbox weekly.


