


The Five Most Famous U.S. Coin Designers
Posted on — Leave a comment- Augustus Saint-Gaudens
- Robert Scot
- Christian Gobrecht
- Charles E. Barber
- George T. Morgan
People collect rare coins for many reasons, including their historical significance and beautiful designs. Behind each rare coin stands a talented designer who left his lasting mark on the world, with hard currency that continues to increase in value today. In many instances, the coin designers worked at the United States Mint, while others were esteemed artists of their time. Let’s explore the fascinating history of the five most famous coin designers in the United States.
Augustus Saint-Gaudens
Born in Ireland in 1848, the son of a shoemaker, Augustus Saint-Gaudens grew up in New York City. After showing an early interest in art, by the late 1890s, Saint-Gaudens became one of the best-known and influential sculptors of his day.
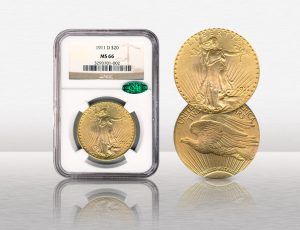
In 1905, after viewing an exhibit of Greek coins at the Smithsonian, President Theodore Roosevelt was inspired to revamp the U.S. Gold Eagle ($10) piece and the Double Eagle ($20) gold coin. Roosevelt commissioned Saint-Gaudens to redesign and elevate these important early American U.S. gold coins into beautiful works of art. Experts widely agree that he succeeded. Saint-Gaudens played an outsized role in the development and beautification of early American coinage
The Saint-Gaudens “Double Eagle,” is considered today by many to be the most magnificent and sought-after U.S. coin of the 20th century. The Double Eagle is highly prized by collectors and has both intrinsic “rarity” value and vast appeal due to its alluring beauty.
Robert Scot
Robert Scot was the first Chief Engraver of the U.S. Mint. Scot was born in Scotland in 1745. After immigrating to America, he began his career engraving plates for Virginia currency banknotes. In 1781, Scot moved to Philadelphia with his family. He set up an engraving shop on the corner of Vine and Front Street.
In 1793, our young nation began to lay its groundwork—construction started on the Capitol building, and the office of Chief Engraver of the United States Mint was also created that year.
After the intended first Chief Engraver, Joseph Wright lost his life to Yellow Fever, George Washington appointed Robert Scot to replace him.
Scot’s early designs include the Flowing Hair silver dollar and the Liberty Cap half-cent. In 1795 Scot created the designs for the first gold coin of the U.S. Mint, with one design featuring a drapery for Lady Liberty. This design was then continued later on with the Draped Bust silver half dollar. In 1796, Robert Scot introduced the Heraldic Eagle reverse, which notably was a modification of The Great Seal of the United States. Today, the Heraldic Eagle still appears on many coins, ensuring Scot’s legacy lives on.
Christian Gobrecht
Christian Gobrecht was born in 1785 in Hanover, PA. As a young man, he apprenticed with a watchmaker and learned engraving. By 1811, Gobrecht was living in Philadelphia engraving bank notes and dies. Initially, his role was as an engraver at the U.S. Mint and eventually, he became the third Chief Engraver. He held the latter position from 1840 until 1844.
Gobrecht had a profound impact on early coinage in the United States. In 1836, Gobrecht designed his most famous work, the 1836 Flying Eagle Dollar. Today, collectors call this the Gobrecht dollar, and it is considered the basis for most of the Liberty Seated coinage that was created over the next 55 years. From half-cent copper coins to $10 gold pieces, Gobrecht’s designs were featured on nearly every denomination of coinage.
Charles E. Barber
Charles E. Barber, born in 1840, served as the sixth Chief Engraver of the United States, from 1879 until his passing in 1917. Barber had a long and prolific career as a coin designer. His best-known coin designs are the Liberty Head coins — Barber dime, Barber quarter, and Barber half dollar, as well as the “V” Liberty Head nickel.
Barber also designed the infamous $4 Stella “Flowing Hair” piece. In 1879, Congress authorized the U.S. Mint to produce a small test run of $4 gold coins so that Congressmen could review them and consider a proposal for a coin that could be used in international trade. Barber created a design that featured a portrait of Liberty facing left with long, flowing hair on the obverse, known today as the Flowing Hair type.
While the quest for an international coin failed and none of these pattern coins ever became a regular issue, collectors then and for generations have coveted these illustrious coins. After the limited run was produced, rumors surrounded the Stellas. While it was said that no coin collector could obtain a Stella from the U.S. Mint, the Congressman who had received the special order apparently used them as gifts and perhaps even payment. It was said that these great works of numismatic art were seen in special necklaces adorning the bosoms of Washington’s top madams, whose brothels were said to be patronized by those same congressmen.
George T. Morgan
George T. Morgan, born in England in 1845 ultimately became the seventh Chief Engraver of the United States Mint in 1917. Morgan is most famous for one of the most iconic designs in the history of U.S. coinage: the widely loved Morgan silver dollar.
The venerable Morgan silver dollar is one of the most popular coins in the numismatic community today. Nearly one billion Morgan silver dollar coins were minted from 1878 through 1921. The silver dollar was created to coin the metal mined from the enormous silver lodes that had been discovered in Nevada. While the first Morgan silver dollars were minted at the Carson City Mint from 1878 to 1893, others were produced in Denver in 1924 and in New Orleans from 1879-1904. Both Philadelphia and San Francisco minted the coins throughout their history.
There is rich and dramatic history for Morgan silver dollar collectors. Over 270 million Morgan silver dollars met their fate in the melting pot under the provisions of the Pittman Act of 1918. The U.S. government ordered this dramatic move to save Great Britain from a banking collapse and may have also helped the Allies win the war.
Want to read more? Subscribe to the Blanchard Newsletter and get our tales from the vault, our favorite stories from around the world, and the latest tangible assets news delivered to your inbox weekly.
Using Gold In a Strategy to Outperform the Market
Posted on — Leave a commentCan gold be more than a safe haven and actually beat the S&P 500 over the long term? One researcher believes the answer is yes.
In a paper from the Lead-Lag Report, researcher Michael Gayed, CFA tested a theory. He wanted to know if the performance of gold relative to lumber could give an investor insight into the future of the market.
His idea was simple: When lumber futures outperform gold, investors can take a more aggressive stance and move into small-cap equities, higher beta stocks, and cyclical sectors. In contrast, when gold outperforms lumber, investors should be less aggressive and move into Treasury bonds, use a buy-write strategy, or move into lower beta/volatility equities.
The basis of this strategy rests on two beliefs. The first is that rising lumber prices indicate that the economy is growing. The author suggests that lumber is especially sensitive to economic cycles given that the average new home in the US requires 16,000 board feet of lumber. This idea aligns with research from the National Bureau of Economic Research and their conclusion that “of the components of GDP, residential investment offers by far the best early warning sign of an oncoming recession.”
The second belief is that gold is a reliable and consistent store of value and that it is largely disconnected from so many other investment instruments. Data from the World Gold Council supports this assertion. Their research, covering more than 25 years of data, shows that “there is no statistically significant correlation between returns on gold and changes in macroeconomic variables, such as GDP, inflation, and interest rates.” Pivoting to gold when the economy suffers makes sense because “returns on gold are less correlated with equity and bond indices than the return on other commodities,” the World Gold Council explains.
So does this theory yield results?
According to the data in the paper, it does. The research shows that investors outperform the S&P 500 by a wide margin by moving into lower beta/volatility equities when gold outperforms lumber.
In fact, between November 1986 and November 2020, the S&P 500 yielded a return of 3,028% while a strategy of rotating into lower beta/volatility equities when gold outperforms lumber returned 4,076%.
While this strategy might not be practical for long-term buy-and-hold investors it does offer an important message. That message is that even over a period of decades, gold is remarkably consistent at signaling where the economy is headed. This reliability illustrates just how useful gold is for investors who want the assurance that at least some of their wealth is held in an asset that has prevailed across many downturns of different types.
Want to read more? Subscribe to the Blanchard Newsletter and get our tales from the vault, our favorite stories from around the world, and the latest tangible assets news delivered to your inbox weekly.
Your Mid-Year Portfolio Check-Up in Four Easy Steps
Posted on — 1 CommentThe year’s half-way over. Now is the perfect time to review your financial situation and your portfolio and make adjustments as needed – to ensure you are on track to meet your financial goals. Ready to get started?

Step 1: Evaluate your risk exposure.
Markets are changing, economic conditions are evolving and your financial goals may have even shifted from the last time you reviewed your portfolio. Take some time to consider how much “risk” you have in your portfolio.
The S&P 500 dropped nearly 20% in 2022. What would another big drop in the stock market mean to you? Would it hurt a near-term financial goal, perhaps a down payment for a home or even your retirement, if you plan to retire in the next several years? Be honest about your risk tolerance level. How you would feel if the equity portion of your portfolio dropped 20% from current levels.
If you have specific goals for your money in the next three to five years, experts often advise you not to invest those assets in the stock market. The reason? During down markets, history shows it can take up to five years for the broader equity market to move back to the breakeven point.
Step 2: Review your asset allocation mix.
Diversification is one of the key elements to successful investing. That simply means gaining exposure to different asset classes like stocks, bonds, tangible assets like physical gold and silver, and even cash. Do the math and calculate how much you currently have allocated to each asset class.
Risk-averse investors generally try to build portfolios in a way that reduces volatility without giving up overall returns. Research shows that both gold and coins have low betas, which means they are both effective assets for improving a portfolio’s performance without sacrificing return.
Blanchard believes that gold and silver bullion in physical form is an appropriate asset for a portion of any properly diversified investment portfolio and recommends investing up to 10% of your overall portfolio in gold, depending on your financial goals and risk tolerance levels.
Step 3: Calculate your liquid assets.
Having access to cash in a hurry when you need it is an essential part of any financial plan. Whether this is a cash reserve fund held in a high-yield savings account, or even held in physical metals (which can be sold instantly if you need dollars), having access to ready cash is important.
Experts typically recommend holding six months of living expenses in a cash reserve account. Or, if you are in retirement, holding up to three years of living expenses in a liquid account is key to ensuring you don’t have to pull out of investments potentially at a loss when you need money.
Physical gold can be considered for a portion of your liquid assets funds. Gold is considered a highly liquid asset because it’s easy to buy and sell. The market for gold is huge, global, and liquid. Gold prices are published 24/7 and gold can be readily sold anytime.
Step 4: Implement changes to your portfolio.
After you’ve reviewed, calculated, and considered the above, take steps to adjust your portfolio. This could include strategies like selling out of a portion of your equity exposure and buying physical metals, opening a self-directed IRA account to add physical gold and other precious metals to your retirement savings, or shifting a portion of your cash reserves into physical metals.
Want a second opinion? Get help from a professional.
If you’d like to discuss your financial goals with a Blanchard portfolio manager, give us a call today. We will take the time to learn your investment objectives, investment time horizon, and risk appetite before making any personalized recommendations for your consideration. We can also answer questions on topics including IRAs, inheritance, storage, and diversification. We’re here to help.
Want to read more? Subscribe to the Blanchard Newsletter and get our tales from the vault, our favorite stories from around the world, and the latest tangible assets news delivered to your inbox weekly.
A Study of How Commodities Perform During Inflation
Posted on — Leave a commentThe Federal Reserve’s ten rate hikes since March of 2022 have helped ease inflation in the US, but we’re not there yet. At a CPI of 4% year-over-year and core inflation that’s even higher, we’re still not at the 2% target.
This might not seem like a problem. After all, if ten rate hikes got us this far down from our peak of 9.1% in June of 2022, then a few more hikes should get us the rest of the way. In truth, the rest of the battle will likely prove difficult. Why? Because companies are still charging more for goods. Consider that groceries increased 8.2% year-over-year last month.
As one global strategist at Société Générale remarked, “Companies are not just maintaining margins, not just passing on cost increases, they have used it as a cover to expand margins.” The research supports this statement. Reporting from the New York Times shows that the average company in the S&P 500 has increased its net profit margin since the end of 2022. Between the pandemic and the war in Ukraine, these companies have many external factors to point to when justifying these increases. For weary consumers, these increases look more like opportunistic moves that will bolster the bottom line.
For investors, the problem is just as vexing. Inflation, while improving, is unlikely to return to the 2% level because rising prices have done little to dissuade consumers from buying. The question is: where can investors allocate more of their portfolio to protect themselves against inflation that might last longer than they can remain solvent?
Fortunately, a few researchers have attempted to answer this question. A paper, The Best Strategies for Inflationary Times, drafted by active investment company the Man Group and a Duke University academic, takes an empirical approach to this timely inquiry.
The group analyzed passive and active strategies among various asset classes during the last 95 years. Their work focused on the US, UK, and Japanese markets. The researchers identified eight periods of rising inflation – defined as a 5% acceleration year-over-year – in the US. During these eight periods, the group examined the performance of equities, commodities, real estate, and fixed income.
They discovered that during inflation commodities have “a perfect track record of generating positive real returns” and generated an average annualized +14% real return.
Gold was part of the commodity group that they analyzed. Specifically, the metal generated an annualized real rate of return of 13% during inflationary periods in the US. This performance even outpaced other commodities like agricultural goods including wheat, corn, soybeans, sugar, cocoa, cotton, coffee, and livestock. Gold also outperformed equities, TIPS, real estate, 2-year Treasuries, 10-year Treasuries, 30-year Treasuries, high-yield fixed income, and consumer durables.
What makes this finding so valuable for investors is that it covers such a range of periods and such a diverse group of assets. Moreover, the research shows that, unlike many other assets, gold still largely held its value even when inflation was not present.
Now is the time for investors to benefit from research like this as the fight to get back to 2% drags on and threatens to be long.
Want to read more? Subscribe to the Blanchard Newsletter and get our tales from the vault, our favorite stories from around the world, and the latest tangible assets news delivered to your inbox weekly.
Nova Constellatio Patterns Coins: The Foundation of Our Numismatic Legacy
Posted on — 1 CommentIn 1783, after eight difficult years, Great Britain declared it would cease hostilities with the United States, creating an end to the long Revolutionary War. The 1783 Treaty of Paris officially ended the war and recognized the United States as an independent nation.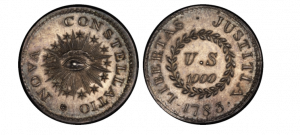
Now, our young nation faced its next serious problem. At that time, there was no official coinage and the thirteen early American states all used different forms of official or unofficial money.
Robert Morris, who served as the U.S. Superintendent of Finance from 1781 to 1784, could be considered the father of the 1783 Nova Constellatio pattern coins and the solution to the young nation’s currency challenges.
Morris began to work with each of the 13 states and their tangled web of monetary systems. He developed a concept of national coinage with a system of 1,000 units that would allow all but one of the thirteen states to normalize their state currency against the proposed national coinage.
This system included a silver Mark of 1,000 Units, a silver Quint of 500 Units, a silver Cent of 100 Units, a copper Eight of 8 Units, and a copper Five of 5 Units.
These ultra-rare and historic early American Nova Constellatio pattern coins were struck in Philadelphia in 1783 under the authority of the U.S. Treasury Department. Benjamin Dudley, an English emigrant and a metallurgist was tasked to prepare dies and strike examples of these denominations. How many pattern coins were struck remains a mystery today and any survivors are ultra-rare. There are five different 1783 Nova Constellatio pattern coins.
If you took Latin in high school, you may recall that Nova Constellatio is Latin for “new constellation.” The aptly named 1783 Nova Constellatio patterns coins reveal thirteen stars among the rays of glory representing all thirteen states as a “new constellation“ surrounding the eye of God. The coins featured the Latin words LIBERTAS and JUSTITIA, intended to signal that Liberty and Justice would govern the new nation.
After all that work, Morris’ coinage plan never got off the ground. The proposal never emerged out of the Continental Congress’s committee that was assigned to consider it. Nonetheless, the intriguingly beautiful Nova Constellatio pattern coins represent an important part of our nation’s early history and America’s numismatic legacy.
Want to read more? Subscribe to the Blanchard Newsletter and get our tales from the vault, our favorite stories from around the world, and the latest tangible assets news delivered to your inbox weekly.
New Data Shows Inflation Is Still Hot, Hot, Hot
Posted on — 1 CommentKind of like the uncle who keeps sticking around long after dinner has ended, inflation is proving hard to say goodbye to.
Ten interest rate hikes later, the Federal Reserve still hasn’t stuffed the inflation genie back into the bottle – as the central bank battles with the highest levels of inflation in the United States since the early 1980s.
New data reveals that despite the most aggressive interest rate hike campaign in history – inflation still isn’t slowing and it’s hot, hot, hot, which means the Fed will likely keep on raising interest rates this summer.
The Personal Consumption Expenditure (PCE) price index headline number jumped 4.4% for the 12 months ending in April, the Commerce Department reported.
The Fed’s preferred inflation gauge and more closely watched core PCE index – which strips out volatile food and energy costs – unexpectedly climbed 4.7% for the year. Surging goods prices led the index higher, including price increases for motor vehicles and parts. Spending on financial services and insurance led the services portion of the index.
Overall prices for services, which include items like medical care, transportation, and hospitality hit, an annual increase of 5.5%. Food prices skyrocketed 6.9% on an annual basis in the latest report.
The overall inflation number is still more than double the Fed’s inflation target at 2%. And, still rising prices of goods and services reveals that inflation has yet to be tamed.
The Fed meets next on June 13-14 and the report triggered speculation the central bank may need to hike again at that time.
Gold has proven diversification properties
As the government fails to put out the inflation fire – the spotlight shines brightly on gold. Throughout history, gold has served as a stable medium of exchange, a hedge against inflation, and today it serves investors well as a private investment outside the global financial system.
Gold and silver bullion ownership serve investors well as safety nets and insurance for their wealth. Allocating up to 10% of your portfolio to precious metals is a prudent diversification method with proven results to reduce volatility in long-term portfolio returns.
As the purchasing power of your paper dollars is eroded every day by inflation, have you considered if now is the time to trade more of those dollars for a hard asset like gold to protect and grow your wealth?
Want to read more? Subscribe to the Blanchard Newsletter and get our tales from the vault, our favorite stories from around the world, and the latest tangible assets news delivered to your inbox weekly.
The 1936 Wisconsin Territorial Centennial Half Dollar
Posted on — Leave a commentIn 1936 the Wisconsin Centennial Commission appointed a Coinage Committee to pursue the development and minting of a commemorative coin to celebrate and help finance the Wisconsin Centennial that year.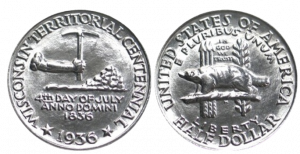
The Wisconsin Centennial half dollar came at a time when the commemorative coin market was booming. This surge was due to previous commemorative coins that were minted in low quantities causing them to appreciate in value significantly. Many of these pieces sold at a premium to their earlier prices.
By the end of March of 1936 the Senate passed the bill paving the way for the half dollars. From there, the bill moved on to the House of Representatives where an amendment was requested which would increase the authorized minting to 25,000.
The job of designing the coins fell to David Parsons, a local art student. The only stipulations he was given was that the seal of Wisconsin Territory had to appear on one side, and a badger had to be on the other. However, his designs were deemed unsuitable mostly due to the light relief that did not adequately show the detail of the art. After the Bureau of the Mint rejected his work, the Wisconsin Centennial Commission tasked New York sculptor Benjamin Hawkins with the job of designing the coins. After being given a three week deadline, Hawkins submitted his designs which the Commission of Fine Arts approved almost immediately.
The image on the obverse, a miners arm gripping a pickaxe, meant to represent the mining activities that drew so many to southeast Wisconsin in the 1820s. In fact, a lead mining boom started in the late 1820s. The metal was so important at the time that many called it “gray gold.”
The badger on the reverse was selected because it is the state animal. This choice also reflects the fur-trading business that characterized the area at the time. The three arrows behind it illustrated the conflict between early settlers and the Black Hawk Indians. The olive branch next to the arrows is meant to symbolize the peace that followed. However, some contend that this “peace” was nothing more than the forceful expulsion of Indians from their land. The “H” appearing below the badger marks the work as Hawkins’.
The Philadelphia Mint struck the coins and made them available to collectors via mail order at a cost of $1.50 per coin. The composition of the coin, 90% silver, 10% copper, made it more valuable than the face value of $0.50. Organizers marketed the coin at the Centennial Cavalcade of Wisconsin in late July of 1936. The complete minting was sold by the1950s.
Today the images on the coin recall the early days of Wisconsin before its admission to the Union in 1848. Prior to this, the Wisconsin Territory had been part of the Northwest Territory before the British gave up the region amid the Treaty of Paris. The coin is a reminder of the hard-won land that became, and remains, such a part of America’s identity.
Want to read more? Subscribe to the Blanchard Newsletter and get our tales from the vault, our favorite stories from around the world, and the latest tangible assets news delivered to your inbox weekly.
What’s Going On With Gold? A Deep Dive with Blanchard Senior Portfolio Manager David Zanca
Posted on — 1 Comment
In 2023, there is a shining star in the financial world: gold is shimmering and bright. Since the start of the year, gold climbed as much as 10% higher, traded above $2,000 an ounce, and approached the all-time record high price for the precious metal.
You may be wondering – what’s going on with gold? To uncover what’s driving the big move higher in gold this year, David Zanca, Senior Portfolio Manager at Blanchard, and a 30-year veteran of the precious metals industry generously shared his insights on recent gold market developments.
Gold has been steadily rising since the start of 2023. What’s driving gold higher?
David Zanca: There is a lack of trust in the U.S. dollar, paper money, and in banks. We have now seen three of the four largest U.S. bank failures in history unfold in the last three months.
My clients are very concerned about the shaky banking system and about storing their wealth in a bank. They are taking action and feel strongly about the importance of owning something real – a tangible asset like gold. With all the questions swirling around the health of the banking system, they believe it is essential to own something real rather than paper – now more than ever.
Essentially, my clients are seeking the safety and peace of mind of owning gold, which is a private investment that can be held completely outside of the world financial system.
Another factor driving gold higher is simply that it’s gone mainstream. When I started my career in the precious metals industry 30 years ago and began professionally trading gold for my clients, gold and silver were fringe investments that very few people in the United States understood or invested in.
Fast forward to today and it’s tough to find anyone with any amount of wealth who isn’t open to investing in physical gold and silver. It’s become an essential hedge for high-net-worth clients to allocate a portion of their wealth to tangible assets like physical gold. Gold ownership has gone mainstream.
What currently is motivating your clients to acquire gold and silver?
David Zanca: There is a recognition among my clients that gold and silver are not just jewelry, silverware, or a nice shiny object – gold and silver are money. Gold has served as money for tens of thousands of years and has an incredible track record as a store of wealth and a medium of exchange and commerce. Gold is money.
Another realization that many clients are having is a reckoning about our governing system and our currency – the U.S. dollar. In the U.S., we’ve had a relatively stable government and currency for many years. That’s changing. What we are seeing among U.S. investors turning to gold now is something that the rest of the world has been doing for centuries – protecting, growing, and storing their wealth in physical gold.
I do consulting calls with large investment firms that, believe it or not, understand very little about the physical gold and silver markets. A few weeks ago, I conducted a call with a group in Germany. They very clearly explained to me that people outside of the U.S., in many countries around the globe, understand what an unstable government and unstable currency feel like and how that impacts paper currency valuations.
A large portion of the German population owns physical gold and silver for investment. As the recognition continues to grow here in America that gold and silver are money and that becomes more mainstream – it naturally shortens the supply, increases the demand for gold and pushes prices higher. That’s why we’ve been seeing this year.
How is this impacting the supply side of the gold and silver market?
David Zanca: The strong demand for physical precious metals is causing shipment delays and supply shortages in both the gold and silver bullion markets.
The shortages are even more dramatic in the rare coin market. In my 30-year career, I’ve never seen such difficulty in finding quality rare coins as we are seeing today.
This is an important market indicator. The rare coin market provides insights and shows what the wealthy and ultra-wealthy are doing now. This group of people are shedding U.S. dollars in exchange for real tangible assets. They won’t sell coins they own at any price – because the question becomes what do you do with the dollars they get back? We’ve seen some ultra-rare coin valuations jump 300-400% in the past three and four years. The lack of supply in the coin market is an important indication of what the ultra-wealthy see coming down the road and where they want to store their wealth. They are holding onto the rarities they own and they aren’t selling.
What type of gold and silver are your clients acquiring?
David Zanca: Blanchard is placing record levels of transactional gold and silver—small spendable forms of gold and silver. Let me explain what that means.
My clients are accumulating fractional coins like British Gold Sovereigns, (just under 1/4 an ounce), Swiss francs (just under 1/5 an ounce), Italian lira, and silver dollars. The reason clients are gravitating toward these coins is the recognition that gold is money. These small coins could be used in a pinch as money, as a functional currency.
Even though gold has climbed a lot this year – is there potential for it to go higher?
David Zanca: Yes. Absolutely. There is no question about it. The key going forward will be the value of the U.S. dollar. Many believe that at some point, the Federal Reserve will have to reverse course and lower interest rates. When they do that, the U.S. dollar could rapidly lose value, which would push gold much higher.
Why is now a good time to increase your allocation to precious metals?
David Zanca: There are many risks right now for paper assets and the U.S. dollar. A banking crisis could be developing. Also, many of my clients are concerned about a national digital currency and what that could mean to their existing balances that they hold in a bank.
What is your advice to investors who are looking to grow and protect their wealth now?
David Zanca: Remember banks can fail. They are failing. When the U.S. dollar falls, when markets change – it all happens very quickly. Once the crisis hits, it’s too late to make a move into the safety of gold.
It’s important for everyone to stop right now and take a look at what’s going on in the big picture. Take the time now and make sure you’ve made the changes you want to make to your portfolio, to your investments –so you can protect your wealth for you and future generations.
There is so much information out there, it’s essential to talk to professionals like Blanchard who have decades of industry experience, so you can get specific recommendations tailored to your particular needs. Gold is a proven solution to protect and grow your wealth. If you’d like to discuss your unique situation, call Blanchard at 1-800-880-4653 and ask for me. Thank you for your time. I look forward to the opportunity to help you.
Want to read more? Subscribe to the Blanchard Newsletter and get our tales from the vault, our favorite stories from around the world and the latest tangible assets news delivered to your inbox weekly.
The 1937 Antietam Commemorates the Deadliest One-Day Battle in the Civil War
Posted on — Leave a commentThe 1937 silver 50-Cent Antietam coin was minted to commemorate the 75th anniversary of a Civil War battle that had major national significance.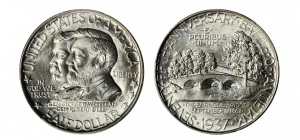
On September 17, 1862, nearly 5,000 were killed and 20,000 were wounded in the Battle of Antietam near Sharpsburg, Maryland. it was the first field army–level engagement in the Eastern Theater of the American Civil War to take place on Union soil and is remembered as the single bloodiest day of the Civil War. Civil war buffs will remember that this battle saw Confederate General Robert E. Lee’s Army of Northern Virginia pitted against Union General George McClellan’s Army of the Potomac.
The period leading up to the battle was fraught with tension. Confederate forces, commanded by the esteemed General Robert E. Lee, were on a winning streak and had initiated an invasion into the Northern states. Their objectives were manifold: to sway the impending midterm elections, garner recognition from Europe, and shift the war’s pressure off Virginia.
On the other side, Major General George B. McClellan led the Union forces. Known for his cautious approach, McClellan moved his troops to counter Lee’s advance into Maryland. In a stroke of luck, the Union stumbled upon the Confederate battle strategies (Special Order 191), offering critical insights into Lee’s tactics, although McClellan’s actions following this discovery were less decisive than they might have been.
The ensuing battle was characterized by ferocity and a high death toll. It was a sequence of relentless attacks and counterattacks across the Antietam Creek, leaving heavy casualties in its wake. The Cornfield, the Sunken Road (also known as “Bloody Lane”), and Burnside’s Bridge were some of the critical conflict zones during the battle.
Despite the intense fighting, the day concluded without a definitive victor. However, due to their numerical disadvantage, Lee’s troops withdrew to Virginia. McClellan’s decision not to chase the retreating Confederates eventually led to his dismissal by President Abraham Lincoln. While the battle ended in a tactical stalemate, the Union considered it a strategic triumph as it halted Lee’s Northern invasion.
The outcome of the Battle of Antietam provided Lincoln with the assurance he needed to present the preliminary Emancipation Proclamation. This declaration asserted the impending freedom of slaves in territories held by the Confederacy, transforming the war’s goal from solely preserving the Union to actively abolishing slavery. Consequently, this new objective made it problematic for European nations to justify siding with the Confederacy.
Baltimore sculptor William Marks Simpson designed the highly sought Battle of Antietam silver half dollar, which was minted in 1937 to commemorate the 75th anniversary of the battle.
The coin’s obverse features the two generals who led the fight that day: General Lee and General McClellan. The reverse reveals a view of Burnside’s Bridge over Antietam Creek which was ground zero for that historic battle in 1862.
The Philadelphia Mint produced the entire mintage of 50,000 silver half dollars in August 1937. The first coin struck was presented to President Franklin Roosevelt on August 12, 1937. The remainder of the mintage were offered by the Washington County Historical Society to the public at $1.65 a piece.
At the time, however, the coin didn’t attract large public interest and, ultimately, 32,000 were sent back to the mint to be melted, leaving a remaining mintage of 18,000 coins. The survival rate is estimated at no more than 15,000 today.
The Antietam silver half dollar attracts strong collector interest today and typically sells for a premium over the price of other commemorative issues with similar mintages and survival rates. Perhaps this is due to the historical and military significance of the battle it commemorated in our nation’s early history.
Want to read more? Subscribe to the Blanchard Newsletter and get our tales from the vault, our favorite stories from around the world and the latest tangible assets news delivered to your inbox weekly.
Why the 1960s and 1970s Are the Playbook for Investors Today
Posted on — Leave a commentRetirement accounts face greater risks today. That risk is inflation.
Rising inflation has moderated a bit in recent months. Yet it is still well above the 10-year historical average of about 1.88%.
The problem is that many retirement accounts were set up, funded, and invested at a time when inflation was low. That time has passed, but few retirement accounts have caught up to the current environment. As a result, the allocations within many of these accounts are not prepared for the possibility of structural inflation pressures that last for the long-term.
Put simply, it’s hard for investors to adapt when most of their working years were characterized by disinflationary pressures.
Consider that from about 1994 to 2020 durable goods prices fell, on average, a few percentage points each year. This happened because that period was an era of globalization as an enormous number of people in East Asia moved from the farm to the factory. As this labor entered the global economy, disinflationary forces took hold. However, today, globalization is coming to an end as the US continues to nearshore manufacturing and bring more supply chains home.
Additionally, labor force growth has slowed to slightly above zero. This is a result of the aging of the domestic employment base. Research from The Brookings Institution concluded that “participation has fallen substantially more among older adults, many of whom are homeowners who benefited from rising house prices.” As a result, we have a “domestic supply shock, when it comes to labor, which adds further pressure to this global supply shock,” according to former Senior Investment Executive at Bridgewater Associates, Bob Elliott.
He continues to explain that this dynamic could be setting us up for an era of inflation, “which is very different from the structural era of disinflation that basically all of us have known our entire lives.” This means that the financial setting of the last few decades will not be a very accurate compass for investors trying to build their retirement savings.
The question remains: what should investors do?
Elliot suggests that investors look at periods that had characteristics similar to those we’re seeing today, namely the 1960s and the 1970s. During those two decades gold increased by almost 400%.
This performance suggests that gold and other commodities could provide a powerful level of protection against the eroding effects of long-term inflation that cannot be tamed with Fed action alone. As discussed above, long-term, structural inflation is a likely result of major global factors like reduced globalization and a dramatic drop in labor force participation. These are factors that cannot be addressed with rate hikes. They are widespread and they are largely irreversible.
Traditional investments like stocks and bonds may still do well in the coming years but the risk for investors is that “well” might not be good enough. That’s why it’s time for investors, especially retirement savers, to seek the asset classes that performed well in eras that look more like today.
Want to read more? Subscribe to the Blanchard Newsletter and get our tales from the vault, our favorite stories from around the world and the latest tangible assets news delivered to your inbox weekly.


