


The State of the Economy and Gold: A Look Back at 2022
Posted on — Leave a commentAs an investor, there was nowhere to hide in 2022. Except in gold. 
The carnage in the investing world was evident everywhere in 2022, with double digit losses in top-rated government and corporate bonds, to the major stock indexes, and to cryptocurrency and tech stock darlings.
Gold: One of the Best Performing Asset Classes in 2022
As inflation ravaged the value of cash, precious metals investors held their value in gold throughout 2022 – proving once again that gold is a store of value and an asset where you can not only grow your wealth but importantly preserve it.
Gold is up 11% from its November low and is nearly unchanged year-to-date. Compare that to the year-to-date asset performance below:
US Corporate Bond Index down 16%
US Government Bond Index down 13%
S&P 500 down 20%. NASDAQ down 34%
Bitcoin down 65%
Apple (AAPL) down 28%
Google (Alphabet Inc. GOOG) down 40%
Tesla down 65%
GameStop down 51%
Economic Growth
The U.S. consumer helped keep the economy afloat in 2022, despite the hefty challenges of decades-high inflation and soaring interest rates. The economy is expected to grow at a 1.9% year-over year GDP rate in 2022, according to the Conference Board.
In 2023? They expect that growth rate to slow to zero percent, with others calling for an outright recession in 2023 with negative economic growth ahead.
Inflation
Runaway inflation in 2022, along with rising interest rates tanked both the stock and bond markets. Going to the grocery store alone ate a big hole in your wallet this year. Egg prices climbed to nearly $10 per dozen in some cities, while overall grocery prices rose 12% in November from a year earlier. That marked the highest food price gains since August 1979 when food prices rose 13.5%.
If you felt like dining out, the situation was no better. Sit down restaurant meals climbed about 9% and restaurants now charge for items like bread that were formerly complimentary. For
For those who like to travel, getting on an airplane was substantially more expensive in 2022 as airline fares increased 36% in November, the biggest jump since 1991.
Interest Rates
After sitting on its hands throughout 2021, while inflation steadily increased, the Federal Reserve finally took action in 2022 to combat inflation.
While many Americans believe that Congress or even the President can control inflation, it is actually the Federal Reserve’s job to do just that. Congress, in fact, explicitly stated that the Fed’s goals are to sustain “maximum employment, stable prices, and moderate long-term interest rates.” The Fed has monetary policy levers, such as raising or lowering interest rates to perform its duties.
Well, the Fed fell down on the job in 2021 and 2022 when it allowed the Consumer Price Index to climb to a high of 9.1% in June – well above the Fed’s stated 2% inflation goal.
In order to try to tame the red-hot inflation that punished Americans at every turn in 2022, the Fed increased interest rates seven times in 2022 raising its benchmark rate to 4.25-4.50%, a 15-year high. The interest rate hikes are designed to slow the economy and thus bring inflation down.
The problem with letting inflation get out of control and so high is that the Fed will now likely cause a recession in 2023 with its aggressive interest rate hikes.
What 2022 Taught Investors about Preserving Wealth
In a year when nearly every single asset class was in the red, gold was a shining star. Gold maintained its value in 2022 offering investors a way to preserve, not lose their wealth. Looking into 2023, an increased allocation to physical gold appears to be a strategic investment move. There are a variety of forecasts that show gold increasing in value to $2,000 and even $3,000 in the year ahead. With looming economic recession on the horizon, gold offers investors a safe-haven in the current economic storm. Do you own enough?
Want to read more? Subscribe to the Blanchard Newsletter and get our tales from the vault, our favorite stories from around the world and the latest tangible assets news delivered to your inbox weekly.
What Could 2023 Bring for Gold?
Posted on — 1 CommentGold is trading around $1,800 an ounce – virtually unchanged from year-ago levels – as gold served one of its ultimate functions in your portfolio: capital preservation. That compares to double-digit losses in the stock and bond market in 2023.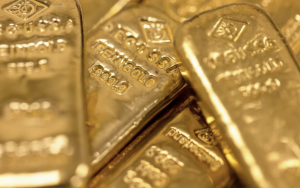
While gold was one of the best-performing asset classes in 2022, what could the New Year bring?
There are four major macroeconomic factors that will keep demand for gold high in 2023, according to Gold Outlook 2023 research from GoldHub:
- A mild recession and weaker earnings have historically been gold-positive
- Further weakening of the dollar as inflation recedes could provide support for gold
- Geopolitical flare-ups should continue to make gold a valuable tail risk hedge
- Chinese economic growth should improve next year, boosting consumer gold demand
Caution Ahead: Recession on the Horizon
As Nobel Prize winning economist Milton Friedman explained: monetary policy acts with long and variable lags. That means that the Federal Reserve’s aggressive seven interest rate hikes in 2022 have yet to impact the economy. The rate hikes are intended to slow the economy and tamp down inflation and Americans will feel that economic impact in the first half of 2023.
“A recession is all but inevitable in the U.S., Euro Area, and UK: Expect a mild U.S. recession in 1H23,” according to a BofA Global Research report. That’s positive for gold ahead.
Central Bank Demand Expected to Remain High
It was a veritable gold rush in 2022, as central banks bought more gold in the first nine months of the year versus any full year since 1987. In the quarter ending September, demand for gold was up 28% year-on-year, reaching 1,181 tons, according to a World Gold Council report.
In the wake of the Russian war in the Ukraine, the U.S. and other western countries froze an estimated $300 billion of Russian foreign exchange reserves, which included tens of billions of U.S. dollars held outside of Russia. This unusual event accelerated the move away from holding U.S. dollars in official central bank coffers and increased the desire to hold gold, which is a universal currency that is not controlled by any one nation of bloc of governments.
Gazing into 2023, high central bank demand for gold is expected to continue as countries move toward a de-dollarization trend.
Epic Gold Rally Ahead?
There are forecasts that could double the price of gold in the year ahead. One factor that could drive gold sharply higher is if Russia moves to accept gold in trade for its country’s coveted oil reserves. “If Russia accepts gold for oil, gold price doubles to $3,600,” says Credit Suisse’s Zoltan Pozsar. “Crazy? Yes. Impossible? No. this was a year of the unthinkable macro scenarios and the return of the statecraft as the dominant force driving monetary & fiscal decisions,” Pozsar added.
Meanwhile, Denmark’s Saxo Bank forecasts that gold could climb to $3,000 and ultimately as high as $4,000 if inflation continues to remain high.
The Bottom Line
There are many factors that suggest gold is poised for a big leap higher. Today’s gold price gives you the opportunity to trade your dollars for more gold. Consider making an increased investment in gold today to protect and grow your financial future in 2023 and beyond.
Want to read more? Subscribe to the Blanchard Newsletter and get our tales from the vault, our favorite stories from around the world and the latest tangible assets news delivered to your inbox weekly.
Say Aloha to Hawaii Plantation Tokens
Posted on — 2 CommentsIf you’ve ever visited the balmy islands of Hawaii, you may have seen a sugar or pineapple plantation during your travels. Just like the “territorial” gold you may be familiar with struck by private minters in California, Oregon, Utah and Colorado, there is a charming subset of territorial coinage known as Hawaiian plantation tokens.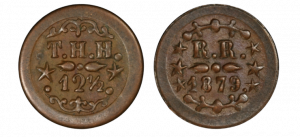
From 1860-1891, plantation tokens were struck for use in company stores on some of the well-known and large Hawaiian plantations. All Hawaiian plantation tokens are rare and highly sought-after today.
The Hawaiian Islands boast a rich and storied history. It was 1778 when British explorer Captain James Cook landed on the Hawaiian Islands. Indigenous Hawaiians had been living on the islands for over 1,000 years, yet there was no established monetary system there.
Hawaiians relied on Cowry shells, certain types of feathers and even sandalwood to use as money before the British arrived. However, in the years that followed, the British and sailors from other countries brought their native currency including British Sovereigns, Dutch Guilders, Spanish Escudos and these were introduced for use in commerce on the Hawaiian Islands.
Hawaii was an agrarian economy dominated by booming activity at sugar cane, pineapple and coffee plantations. In order to fill the currency void, the plantations created tokens from 1860-1891 that could be used as cash at their company stores. Many of these tokens were made in Maui by blacksmiths and were paid to plantation workers. While the plantation tokens were not legal tender, they did circulate as money throughout the Hawaiian Islands in the late 1800s
The exception appears to be the Waterhouse tokens, which were likely created as advertising pieces since they held no value at his stores.
Various tokens issued by several plantations included the Wailuku, Thomas Horton, Waterhouse and Haiku. These Hawaiian tokens are well-known within the advanced numismatic community and remain highly sought after by collectors today.
Want to read more? Subscribe to the Blanchard Newsletter and get our tales from the vault, our favorite stories from around the world, and the latest tangible assets news delivered to your inbox weekly.
Inflation: Not Just an American Problem
Posted on — Leave a commentConsumer inflation rose 7.1%, down from a summer peak of around 9% this year, according to the November consumer price index report. Yet, once you dig into the data, the cost of many things you buy are still rising – like groceries, dining out, recreation services and haircuts and other personal care services.
In 2022, inflation is not just an American problem – it’s a global problem. Heading into 2023, it’s unlikely this stubborn rising price problem will go away anytime soon.
There is double-digit price inflation in almost half the world right now, with some countries even experiencing triple-digit inflation. Here’s a look at the top 10 eye-popping inflation rates around the world right now.
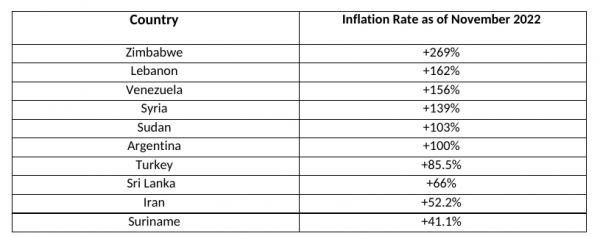
Source: TradingEconomics
This type of inflation is debilitating. While we hope the United States will never experience hyperinflation like the type that is hitting Venezuela, hope is not a plan. Here is a suggestion from a recent article: “How to prepare yourself for hyperinflation: tips from the Venezuelan experience.”
“Purchase a more stable currency: If the money in your bank account starts to lose purchasing power, buying another currency in which you can accumulate good savings is a must. I also recommend buying commodities like gold, but be careful where and how you store it. Purchasing real estate is not recommended since properties can lose their value quickly when distrust in the local economy collapses and people start fleeing.”
While gold is a precious metal, it is also a currency. In fact, it is a universal currency that is accepted in every country in the world today. There’s never been a better time to consider shifting some of your dollars into a more reliable currency like gold.
High inflation is not limited to emerging markets and developing nations – many developed nations are shouldering high levels of inflation in 2022. Take a look at the list below.
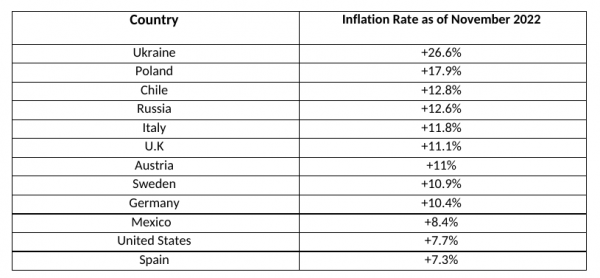
Source: TradingEconomics
Inflation Isn’t Going Away Soon
While the Federal Reserve embarked on a campaign to slow the economy and bring down inflation with sharply higher interest rates in 2022, once inflation is ingrained in an economy, or in this case the global economy, it doesn’t just disappear quickly.
Here’s what Time magazine said last month: “Economists and financial experts agree on one thing: Higher prices will likely last well into next year, if not longer. And that means Americans will continue to feel the pain of higher prices for the foreseeable future.”
How You Can Deal With Ongoing Inflation
As a consumer, it’s hard to avoid higher prices at the grocery store and restaurants – after all, we all need to eat. Many Americans are making choices however and choosing to cook at home more, eat out less and even cut back on expensive cuts of meats or eggs – which have suddenly rocketed higher in price.
Most Americans today aren’t used to shortages or sharply higher prices. We haven’t lived through an inflation crisis in 40 years. During this time, it’s important to maintain a cash reserves account – some experts recommend anywhere from 6 months to 2 years of living expenses, depending on your age and the reliability of your income. That sounds like a lot, but with a recession potentially around the corner in 2023, maintaining a healthy emergency fund could be your saving grace.
Use Gold as Your Emergency Fund
Holding your dollars in a bank account means they simply become worth less every day they sit there. Investors can consider holding their emergency fund in gold. If you need to tap your emergency fund for any reason, you can liquidate or sell your gold for dollars instantly – the same day.
Second, keep investing. In inflationary times, more than ever, it is important to keep investing – in order to prevent your purchasing power from eroding. Physical gold is up 9% since early November, with predictions it could climb as high as $3,000 in 2023.
Gold is one of the most liquid markets in the world, a reliable place to store, protect and grow your wealth. Inflation is here to stay for the foreseeable future and if you haven’t already, consider making an increased investment in gold today to protect and grow your financial future.
Want to read more? Subscribe to the Blanchard Newsletter and get our tales from the vault, our favorite stories from around the world and the latest tangible assets news delivered to your inbox weekly.
Five of The Most Valuable Coins in the World
Posted on — 8 CommentsCoin collecting is widely recognized as one of the most rewarding pursuits in the world. Once known as the “hobby of kings,” it is now called the “king of hobbies”. As this review of the five most valuable coins in the world will reveal, it is indeed rewarding both personally and financially.
Coin collecting has its roots in the European Renaissance among wealthy Europeans. By the late 1590s coin collecting had become extremely popular among the nobility and the first known coin auctions were held in 1598 in Holland. Historically, collectors purchased rare coins for their historical significance and beauty, but as these collections fetched significantly higher values, investors began turning to rare coins as a new type of asset class for capital appreciation, diversification, non-correlation to stocks, and as a hedge against inflation.
Here is a list of the five most valuable coins in the world.
1. 1794 Flowing Hair Silver Dollar: $10 Million
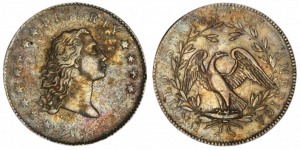
In 2013, a legendary PCGS SP66 Flowing Hair dollar sold for $10,016,875. Some experts believe this coin, considered to be one of the greatest American numismatic specimens ever, could be the very first silver dollar ever struck. This coin featured an earlier die state than any other known specimens and is the only one with proof-like fields.
The Act of April 2, 1792, authorized the silver dollar and also established the United States Mint to create our nation’s coinage. The authorization of the silver dollar was extremely significant historically as it was the standard unit on which the United States monetary system would be based. All other coins struck at the United States Mint represent either fractional parts of the dollar or multiples of that unit.
2. 1933 Saint-Gaudens Gold Double Eagle: $18.9 Million
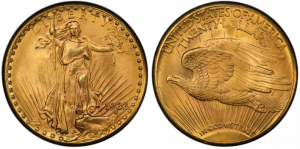
In 1933, the U.S. Mint struck 445,500 Saint-Gaudens Gold Double Eagles with a face value of $20. After these coins were produced in 1933, President Roosevelt, took the United States off the gold standard in an effort to help the American economy out of the Great Depression.
All but 10 of these beautiful coins were lost to the melting pot. They never circulated. One of these stunning coins mysteriously landed in Egypt and into the collection of King Farouk, a voracious coin collector. When the renowned Farouk collection, totaling over 8,500 medals and coins, was sold in 1952, the 1933 Double Eagle went missing.
This extremely rare and infamous coin did not resurface until 1996 in the U.S. and was seized by the U.S. Secret Service. The coin was returned to the United States Mint as a result of the Department of Justice’s settlement of a forfeiture action and, in that landmark legal settlement, this one coin became the only 1933 Double Eagle that is legal to own in a private collection.
3. The 1787 Brasher Doubloon: $7.4 Million – placed by Blanchard & Co.

In 2011, Blanchard and Company made numismatic history by placing the famed Brasher Doubloon for a record $7.395 million with a Wall Street investment firm. The identity of the buyer was not disclosed. The coin, dated 1787, was graded AU50 by PCGS and has a green CAC sticker.
This historic rarity was minted by Ephraim Brasher, a goldsmith, and neighbor of George Washington. The 1787 Brasher Doubloon is the first American-made gold coin denominated in dollars. The U.S. Mint in Philadelphia didn’t begin producing coins until the 1790s, and in our nation’s earlier years, it was common to use foreign coins in everyday transactions. The beautiful coin contains 26.66 grams of gold — slightly less than an ounce.
At the time of the sale in December 2011, CAC founder and Blanchard partner John Albanese hailed the coin as one of the most iconic pieces in all of the numismatics and the holy grail of all collectible gold coins. And it still is. Only seven Brasher Doubloons in all survive, and the one placed by Blanchard is the sole specimen with the initials of its maker, EB for goldsmith Ephraim Brasher, punched across the breast of the eagle depicted on the coin. The other six specimens feature EB on the bird’s right wing.
Ahead of the sale, at Blanchard’s New Orleans headquarters, the doubloon sat sealed in a protective case on an office table surrounded by three armed guards. Elevators were shut off to the 19th floor of a downtown office building housing Blanchard’s offices, and doors inside the office were locked, CBS News reported at the time. The coin, which is smaller than a half dollar but heavier, was to be delivered by armored vehicle to the buyer over the weekend.
Blanchard & Co. remains proud of its part in the transaction: The Brasher doubloon indeed falls into the rarefied strata of coin collecting and remains one of the most valuable coins in the world today.
The Brasher Dubloon made history again in January 2021, when another specimen sold at auction for a mind-blowing $9.36M.
4. The 1343 Edward III Florin: $6.8 Million

This coin is 679 years old and is thought to be one of only three of the same coins to have survived the centuries thus far. Two specimens of this extreme rarity are housed in the British Museum in London, both of which were found in the River Tyne in 1857. The third coin was found by a prospector with a metal detector in 2006 and was sold at auction in the same year. It’s now estimated that the coin is valued at around $6.8 million.
The front of the coin reveals King Edward III on his throne with two leopards’ heads on either side, while the reverse shows the Royal Cross inside a quatrefoil. Because of its design, the coin is also known as the Double Leopard.
5. 1913 Liberty Head Nickel – Morton-Smith-Eliasberg: $4.56 Million
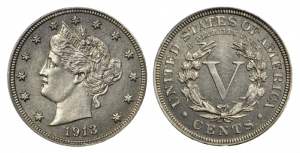
The renowned Morton-Smith-Eliasberg Liberty Head Nickel sold $4,560,000 dollars at auction in 2018. One of only five known specimens, this version is considered to be the finest known example. It was owned by Louis E. Eliasberg a legendary Baltimore banker and American coin collector. In 1950, Eliasberg completed his collection of every coin ever minted by the United States dating back to 1792. His sons eventually sold his famed collection for about $45 million.
Parting Thoughts
Wondering about the advice Blanchard gives to coin collectors and investors? Always acquire the highest quality coin that fits in your budget and you will never be disappointed.
Want to read more? Subscribe to the Blanchard Newsletter and get our tales from the vault, our favorite stories from around the world and the latest tangible assets news delivered to your inbox weekly.
Inflation Battle Isn’t Over Yet. Fed Hikes Rates Ahead of Holiday
Posted on — Leave a commentThe Federal Reserve hiked interest rates for the seventh time in 2022 on Wednesday, increasing its benchmark rate to 4.25-4.50%, a 15-year high. The Fed’s rate increase of 0.5 percentage points was smaller than the last four rate increases. The gold market traded above the $1,800 level after the Fed news and the current environment for gold is positive.
- Over the past two months, gold has soared 10% higher, trading from a low at $1,638 in early November to above $1,811 this week, and the trend points to more gold gains ahead.
Despite the Fed’s aggressive rate hike campaign this year, consumer inflation remains sharply elevated at 7.1% in November. While that is down from the 9% pace in June, inflation remains well above the Fed’s stated 2% target rate.Fed’s Big Inflation MistakeInflation took hold in the spring of 2021 and accelerated quickly in the months that followed. At that time, the Fed incorrectly called inflation “transitory” and failed to act last year to stem the rising price trends.The red-hot inflation levels create financial challenges for Americans across all income spectrums and the Federal Reserve has yet to tame high prices. The Fed has driven interest rates higher for everything from home mortgages to car loans to credit cards, and many Americans say they’ve reduced their holiday spending plans this year due to the runaway higher prices.The Federal Reserve’s interest rate hikes also contributed to the plunge in stock market prices in 2022, with both stock and bond markets showing double digit declines year-to-date.Inflation Isn’t Even Close to Being OverWhile some categories like used cars and airline tickets fell in November, many consumer items saw continuing price increases. Grocery prices, dining out, recreation services (like tickets to sporting events) and prices for haircuts and other personal care services all increased. Wage inflation is also appearing amid the tight labor market which, in turn, creates conditions for a wage-price spiral, as higher wages fuel even more increases in consumer goods and services.Brace for More Fed Rate Hikes…and Recession in 2023The Federal Reserve’s projections on Wednesday reveal that most Fed policymakers expect to continue raising interest rates next year – pushing the benchmark rate as high as 5-5.25%, which is expected to push the economy into a recession.Protect and Grow Your Wealth with GoldWith the potential for a Fed-induced economic recession in 2023, the outlook is bright for gold. In the midst of the 2022 inflation crisis, precious metals are among the best performing asset classes of the year. Looking into 2023, Saxo Bank predicts gold will climb to $3,000 an ounce. Before gold climbs even more, consider using current market levels to protect and grow your wealth with an increased allocation to gold.
Want to read more? Subscribe to the Blanchard Newsletter and get our tales from the vault, our favorite stories from around the world, and the latest tangible assets news delivered to your inbox weekly.
The First Early Gold Coin to Feature a Native American
Posted on — Leave a commentA new Quarter Eagle gold coin, worth $2.50 in face value was issued in 1908 – known as the Indian Head. This is the first coin to feature a real Native American. Earlier coins that featured Native Americans were stylized portraits and did not represent real people. Also notable to collectors, the Indian Head gold pieces that survive today remain the only U.S. circulating gold coins with a recessed design – or one that is in sunken relief below the surface of the coin.
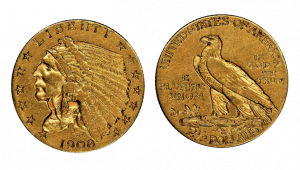
Boston sculptor Bela Lyon Pratt, a student of Augustus Saint-Gaudens, designed this arresting coin. The obverse reveals a dramatic head of a Native American man, wearing a headdress and facing left. The designer’s initials, BLP, are etched just above the date.
Pratt based the design on the reverse of the 1907 $10 gold coin: The reverse features a standing eagle on a smattering of arrows, with its left talon showcasing an olive branch in place. The mint mark is revealed on the left side of the arrowheads.
The U.S. Mint produced Indian quarter eagles intermittently from 1908 until 1929. Within that series, there are 15 different varieties – with the rarest being the 1911-D. Only 55,680 in 1911 at the Denver mint were produced – and that is considered to be a key date for this coin. Key date coins are those with a low mintage or with mintages with few survivors and they are prized in the world of numismatics.
During this time period, the public harbored an unfounded concern that the recessed design of the Gold Quarter Eagle would collect germs. In fact, well-known Philadelphia numismatic Samuel Chapman wrote to President Theodore Roosevelt in 1908 after the first issuance to level a critique of the new design. The indentations in the new Indian Head Quarter Eagles would collect dirt and germs, Chapman claimed.
Due to these fears, few people were interested in saving these coins for their coin collections. Today, only a few circulated pieces are known to survive, perhaps from prescient collectors who ignored the public hysteria, but ultimately had to sell their coins in favor of food for family members during the Great Depression.
Many survivors today boast a striking bronze-gold color. Imagine the stories these coins could tell of this era just before the Great Depression. See our collection of Indian Head Quarter Eagles that we have on offering now.
Want to read more? Subscribe to the Blanchard Newsletter and get our tales from the vault, our favorite stories from around the world, and the latest tangible assets news delivered to your inbox weekly.
Four Reasons Why Gold Has a Place in Your 2023 Portfolio
Posted on — Leave a commentGold Offers Diversification that is Disappearing

Diversification is what prevents catastrophic loss. The problem is that many investors are not as diversified as they think they are. In recent decades, assets have begun to exhibit similar movements which means that one of the most important strategies an investor has is beginning to falter. In fact, between the periods of 1990 to 2000 and 2006 to 2016 cross-asset correlation increased by 33%. This trend puts investors in a difficult position because the market today offers fewer opportunities to diversify investment. Fortunately, gold gives investors a chance to renew their diversification because it is an asset that has had a low or negative correlation with equity indices for almost twenty years.
Gold Offers Improved Liquidity
While US citizens often choose to hold gold as an investment, many individuals in other countries use gold as a way to boost liquidity. For example, it is common for gold owners in India to rely on gold as a source of collateral when seeking a loan. This means that gold owners can often obtain capital faster when they pledge gold which is universally acknowledged as a global currency. For this reason, just over half of investors in India own some form of gold. Moreover, the average Indian household stores 11% of its wealth in gold. Loan issuers can process transactions faster when they have the kind of assurance that comes from gold. The relationship between gold and liquidity has grown since the onset of the pandemic which has left many people seeking access to capital.
Gold Helps Protect Against Tail Risk
Tail risk represents the fact that remote events happen less frequently, but when they do occur they generate an enormous effect on outcomes. The word “tail” is used because it refers to the left and right sides of a normal distribution curve – a bell curve – which resembles tails. This concept is relevant to those investing in precious metals because the COVID pandemic was an upheaval that had a massive impact on all aspects of life, especially finances. It is no surprise that silver and gold delivered returns of 47% and 24% respectively in 2020 when the pandemic began to impact everyday life. These events serve as a reminder to investors that the unthinkable can in fact happen and when it does it is best to be prepared with an asset class that will outperform when tail events occur.
Gold Can Create Stability When the Yield Curve Inverts
An inverted yield curve has preceded the last seven recessions. The current yield curve is inverted which has prompted many investors to reconsider their strategy. The yield curve inverts when investors become pessimistic about the economic setting of the near term. As a result, investors demand a greater return on short-term investments which are seen as riskier. Equity and bond investors are taking the most recent inversion as a warning that they need to broaden the range of assets held in their portfolios. Many of these same investors remember that the value of gold increased dramatically after the global financial crisis that started in 2008 when the Producer Price Index for gold rose 101%. Forward-thinking investors are applying lessons from the past to protect their future.
Want to read more? Subscribe to the Blanchard Newsletter and get our tales from the vault, our favorite stories from around the world and the latest tangible assets news delivered to your inbox weekly.
Why The Next 20 Years Won’t Look Like The Last 40
Posted on — Leave a commentWhen a man like Russell Napier speaks, people listen.

And they should. In the summer of 2020, he forecast the inflation of today long before anyone saw it. There were many who didn’t agree with his assessment. After all, we had not seen any meaningful inflation in about 40 years.
For nearly 30 years Professor Russell Napier has advised global institutional investors on their asset allocation strategies. He is also the author of Anatomy of The Bear: Lessons From Wall Street’s Four Great Bottoms, which examines how bear markets form and how they end. He is the founder and course director of The Practical History of Financial Markets course that is part of the Edinburgh Business School MBA.
In recent months Napier has made some of the boldest forecasts of his career. When asked what he sees ahead for the US economy he has two words: financial repression.
The term financial repression describes a setting in which the government allows the rate of inflation to exceed nominal interest rates. Why do this? Because doing so enables the government to diminish debt via inflation. As Napier explains, “engineering a higher nominal GDP growth through a higher structural level of inflation is a proven way to get rid of high levels of debt.”
Napier sees this as an imperative because the current total private sector and public sector debt in the US is at 290% of GDP. At this level, it will not be long before the government is forced to engineer financial repression to avoid disaster.
He expects consumer price inflation to settle into a range between 4% and 6%. Napier explains that this is the likeliest range because it is what the government can get away with because financial repression, by design, steals from savers and old people. Therefore, it must be done slowly to avoid the pain that is too intense.
What does this mean for investors?
Napier has thoughts.
He explains that “gold will do well once people realize that inflation won’t come down to pre-2020 levels but will settle between 4% and 6%.” This makes sense because it is what we have seen before.
Financial repression was used in the US between the period of approximately 1945 and 1975. During this same period, gold increased by approximately 72%.
Government bonds will likely be a bad place to be invested because the rise in the cost of goods will exceed the interest rate earned on those investments.
Even equities will present problems because so many investors have committed their savings to index funds largely composed of companies that fared well in the previous decades which were fundamentally different from what Napier believes is ahead of us.
The problem for most investors is that financial repression is a foreign concept because we have not seen it for 40 years. “Many investors today still pretend that we’re in the system that we had from 1980 to 2020. We’re not. We’re going through fundamental, lasting changes on many levels,” he remarks.
Forward-thinking investors who heed Napier’s words will be well positioned to not only weather the coming climate but to flourish in it.
Want to read more? Subscribe to the Blanchard Newsletter and get our tales from the vault, our favorite stories from around the world and the latest tangible assets news delivered to your inbox weekly.
The State of the Economy and Gold: Tipping Toward Recession
Posted on — Leave a commentYou may not have noticed, but gold has been up 10% since early November. Indeed, gold jumped again this week scaling the $1,800 mark to hit a new three-and-a-half-month high. Comments from Federal Reserve Chairman Jerome Powell suggesting the central bank will pull back the pace of its interest rate hikes boosted gold and depressed the dollar.

Let’s take a look at the state of the U.S. economy and what it means for gold.
Recession Looming. As rising interest rates impact the economy and higher prices derail consumer spending, a recession is a forecast for early 2023. Here’s what Beth Ann Bovino, Chief Economist, U.S. & Canada S&P Global Ratings, says: “Economic momentum has slowed with a recession next year increasingly likely. As extremely high prices damage purchasing power and aggressive Federal Reserve policy increase borrowing costs, we continue to expect a shallow recession for the U.S. economy in the first half of 2023. Our U.S. GDP growth forecast is 1.8% for 2022 and -0.1% for 2023.”
What this means for gold: The Fed could ease monetary policy in 2023 to support an economy in recession, which will further weaken the U.S. dollar and in turn boost gold. Inflation has eased slightly, but still remains high opening the door to stagflation (low or no economic growth and high inflation) and that is positive for gold. In fact, gold is the best stagflation performer since 1973 with a 12.8% annualized return, according to a Gold Hub.
Midterm election: Americans now face a divided government, which is expected to lead to a gridlocked Congress for the next two years. The Republicans control and House of Representatives and the Democrats control the Senate, both with slim majorities. Don’t expect any significant changes in economic policies. Split government rule increases the risk of a government shutdown and a bruising fight over the debt ceiling in 2023.
What it means for gold: This is bullish for gold. Expect safe-haven demand to boost investor appetite for gold as headlines begin to focus on the debt ceiling borrowing limit. The debt-ceiling standoff in 2011 that triggered a run to the then-all-time high in gold prices over $1,900 an ounce and an entrenched political situation would again be positive for gold next year.
The Fed and monetary policy: The Fed meets next on Dec. 13-14 and is expected to hike interest rates again – but at a smaller amount. Currently, Wall Street expects a .50 basis point rate hike, lower than the recent .75 bp hikes.
What it means for gold: This is positive for gold. “A pivot away from the aggressive rate hikes through 2023 should bring new buyers back into the market,” according to a BofA Global Research report. Looking into 2023, BofA Global Research forecasts gold to climb to $2,000 an ounce.
Inflation: The consumer price index (CPI) revealed that inflation eased slightly in October to an annual rate of 7.7%. That is down from September’s 8.2% reading but still remains extraordinarily high. Looking into 2023, inflation is expected to remain high amid continued supply-chain disruptions. Core prices for consumers, which excludes food and energy, are forecast to remain well above the Federal Reserve’s 2.0% target in 2023.
What it means for gold: This is positive for gold. A stronger dollar held back to gold in 2022 as the Fed’s aggressive interest rate hikes this year boosted the currency. However, expect the Fed to pivot on its interest rate campaign as U.S. economic growth weakens, which will open the door for gold to move sharply higher in the weeks and months ahead.
Want to read more? Subscribe to the Blanchard Newsletter and get our tales from the vault, our favorite stories from around the world and the latest tangible assets news delivered to your inbox weekly.


