


America’s First Silver Dollar
Posted on — Leave a commentMany people are surprised to learn that the origins of US currency aren’t found in our country. They’re found in the Netherlands.
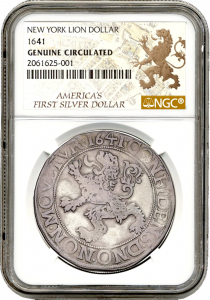
Upon arriving in the New World, the Dutch established the colony of New Amsterdam which is known today as New York. Here, immigrants traded Lion “Daalders,” a coin first minted in Holland in 1575. By 1617 the coin was popular wherever commerce was thriving; America, Europe, Africa, the Middle East, and the Orient. The reason for its widespread use could be found in its practicality; the coin was relatively small, and lightweight. Soon, the Lion Dollar became the silver standard across the globe in the 16th and 17th centuries.
Many credit the Lion Dollar as a major stabilizing force in the fledgling economy of the New World. In these early days, colonial paper money was experiencing accelerating inflation. The Lion Dollar helped ease this surge with a store of value that was universally recognized. However, the Lion Dollar’s enduring claim to fame is that it was the first silver dollar circulated in the US. Given that New Amsterdam (New York) was a major entry point for so many seeking a new life in America, the Lion Dollar fast became the currency of so many of the Europeans entering the country.
The coin was struck in .750 fine silver. The design harkens back to the Dutch coat of arms and features an armored knight with a shield adorned with a lion. The animal is a “rampant stance.” This position (standing with forepaws raised) symbolizes bravery and intrepidness. The word “rampant” is from the old French for “rearing up.” The lion also represents the notion of royalty and nobility. The obverse features the same lion in a larger presentation. The outer rim features the words, “CONFIDENS. DNO. NON. MOVETVR,” which translates to “who trusts in the Lord is not moved.”
While the Lion Dollar helped our new economy prosper, few remember that the coin’s original associations are less pleasant; the piece was first issued as war coinage. Officials in Holland minted the coin to help finance the Eighty Years War against Spain (1568-1648). This approach to raising funds worked because the coin had a 75% silver content but was sold at a value above the actual silver weight (ASW). As a result, the government could yield a 10% profit on each coin sold.
In time, British allies came to prefer the coin because its value increased as it moved east to India, and China where the purchasing power of silver was higher than in Europe.
Today, the Lion Dollar is a reminder of how the history of countries and nations is intertwined. What began as a war coin in Holland evolved into a staple of commerce in the New World. Now that history can be yours.
“Thar’s gold in them thar hills!”
Posted on — Leave a commentOr rather, “There’s millions in it!” (Doesn’t have quite the same ring, does it?)
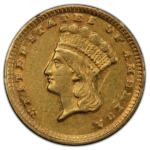 This is a story about the 1858-D $1 Gold coin.
It turns out that “Thar’s gold in them thar hills!” is a Hollywood western invention, by way of Mark Twain.
But let’s rewind.
In 1829, the Georgia Gold Rush started. Thousands of miners flocked to the area—and Dahlonega, Georgia, quickly became a gold-rush boom town. But then in 1848, gold was discovered at Sutter’s Mill in California, and the Georgia gold miners started pining yonder, since most of the easy gold was already gone from the Georgia rivers.
Dr. Matthew Stephenson wasn’t having it.
Stephenson, assayer of the Dahlonega Mint, climbed the courthouse steps one day and speechified thus:
“Boys,” he asked, “why go to California?” He pointed at a mountain. “In that mountain lies more wealth than you’ve ever dreamed possible, there’s millions in it!”
“There’s millions in it!” (The good doctor repeated.)
His saying became famous … because the miners took it to California with them. Anytime one of them was ready to give up in despair, the cry “There’s millions in it!” from a fellow forty-niner would revive him.
Mark Twain got wind of this while visiting a mining camp and used the phrase in one of his books. The phrase went viral nationwide and in about the 1930s, it morphed into a movie-ready “Thar’s gold in them thar hills!”
In any case, the gold in them thar Georgia hills was plentiful, and the Dahlonega Mint minted it.
The Confederate Congress closed the mint in June 1861, and the mint never resumed operations. In all, the mint was in operation for only 23 years. All of its coins are rare, and the NGC has recorded only seven MS63 1858-Dahlonega $1 gold coins.
The Ultra Rare Ram’s Horn Wire Gold Specimen
Posted on — Leave a commentGold is a commodity. This means that one ounce of pure gold found in the U.S. is worth the same as one ounce of pure gold found in Russia. The value is consistent across the globe. This consistency is part of the appeal of gold. It is a fungible, meaning that it doesn’t matter whether you have a gold coin, bar, or ingot. As long as the purity and the weight are identical it’s all worth the same amount. Or is it?
A peculiar discovery in the Ground Hog mine in Colorado in 1887 challenged that thinking.
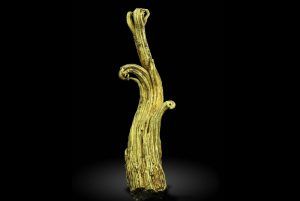
Miners were astounded when they found a deposit of gold that looked like a braid of icing piped out of a pastry bag. Others thought it looked like a ram’s horn. Something was different about the way this deposit formed. It was not a nugget like most gold. “It’s truly a unique object—there’s nothing even comparable to it,” explains John Rakovan, a mineralogist working at Miami University in Ohio. In fact, Rakovan estimates that there are only a few specimens of this kind in the world.
The “branch” of gold is small. It is a 263-gram, 4.7 inch piece. Based on current spot prices the value of the gold within would be worth about $12,744. However, the rarity of the formation completely changes its value. As Rakovan said, the Ram’s Horn gold specimen is worth “a very pretty penny.” He declined to offer a number. Most of those who have studied the piece professionally are scared to cite a dollar value for fear of prompting a theft.
The strange shape has sparked much speculation about its atomic structure. Gold deposits often have rounded, dull edges and corners resulting from the effects of water against the surface.
Experts describe this piece as a crystalline structure. For decades scientists have wondered how the piece formed. Getting answers would mean cutting into the piece and destroying what makes it so unique. However, new technology may provide new insight into the geological wonder.
Recently, physicists at Los Alamos National Laboratory’s neutron science center began exploring new ways to examine the gold without damaging the piece. Their solution was to bombard the Ram’s Horn with neutrons. This approach is used to reveal the number of crystals present in a structure. After high-security transportation to the lab the experiment determined that the formation consisted of just a few crystals.
Rakovan and others believe that these results can shed new light on our understanding of geochemical processes at work in gold formation.
The rarity of the Ram’s Horn wire gold specimen also suggests that not all gold is the same. The ounces of gold in this piece are not like anything else. What makes the Ram’s Horn so valuable is that its origins still baffle scientists. Though the neutron experiment has provided answers, scientists still have a long way to go before they achieve a complete understanding of how the Earth creates such wonders.
Today the Ram’s Horn is stored at Harvard’s Mineralogical and Geological Museum.
Ram’s Horn wire gold specimen. Photo Courtesy LACD
Sign up for our newsletter! Get our tales from the vault, our favorite stories from around the world and the latest tangible assets news delivered to your inbox weekly.
Will the US Ever Be Able To Pay Its Debt?
Posted on — Leave a comment
When an individual can’t pay the mortgage on their house, the bank takes possession of the home.
When a person can’t pay their car loan, the finance company repossesses the car.
The U.S. government is racking up more and more debt every month, with a total of $22 trillion of debt owed today.
Just like a person who doesn’t pay off their credit card bill in full at the end of the month has to pay interest on that balance, so does the government.
No doubt interest rates are extremely low right now for the U.S. government – around 1.49% for a US 10-year Treasury note.
But, the interest on $22 trillion still adds up, to the tune of about $1 billion dollars a day in interest, according to Michael Peterson is CEO of the Peter G. Peterson Foundation, a nonpartisan fiscal watchdog group.
That’s a billion dollars a day that the US government needs to collect from its taxpayers – yes you – in order to pay interest on debt.
That’s a billion dollars that isn’t going into the Social Security fund, or isn’t going to fund schools, or to build new roads, highways or improve our aging infrastructure system.
The debt and deficit have climbed in recent years. That’s unusual because the economy has been growing. Historically, the debt only rises when we are in a recession and the government needs to spend a lot of money in fiscal stimulus to help boost economic growth. Not now. The government has been on a borrowing binge during good economic times. The recent tax cut, while it may have benefited you personally, has decreased government inlays and contributed to rising debt levels.
What Lies Ahead?
The piper must always get paid. The bank wants your monthly mortgage payment and the auto finance company wants your monthly car payment. The US government will continue to pay interest on the $22 trillion and rising debt levels.
“Rising debt will make it harder to maintain economic growth, boost living standards, respond to wars or recessions, address social needs and maintain our role as a global leader,” said William G. Gale, author of Fiscal Therapy: Curing America’s Debt Addiction and Investing in the Future (Oxford 2019) said on CNN last month.
Once interest rates rise, (they always have in past generations), the interest payments on government debt will also go up.
Rising debt levels will make it more difficult for the government to meet its obligations to future Social Security recipients, fund schools and repair highways in the future.
$22 trillion is a big tab to pay off.
Don’t expect that debt to get paid off anytime soon.
While government may not have its fiscal house in order, you can take control of your financial future with investments in tangible assets like gold bullion.
The rising debt levels are just another way the government degrades the value of its fiat currency. The risk remains that future Administrations could choose to inflate their way out of the debt crisis, by devaluing the US dollar and printing more paper dollars.
The case for gold ownership grows stronger every day. If you haven’t fully diversified your portfolio with tangible assets, take action today to protect your wealth.
If you’d like to learn more, sign up for our newsletter. Get our tales from the vault, our favorite stories from around the world and the latest tangible assets news delivered to your inbox weekly.
Coveted Mexican Coin Recovered from Shipwreck
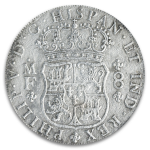
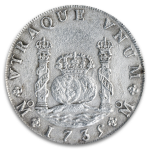
Posted on — 2 CommentsIf there is one classic Mexican coin that serious U.S. numismatic collectors covet, it’s the Pillar dollar.
The 8 Reale, also known as “piece of eight,” is an iconic silver coin which was struck at the Mexico City Mint between 1732 and 1772.
Mexican Pillar dollars were minted across South America under Spanish colonial rule. These coins circulated widely in colonial America and were even legal tender in the U.S. until the Coinage Act of 1857.
We have one of these exquisite rarities that was recovered from a dramatic 1739 shipwreck.
In 1739, a Dutch East India company ship – the Rooswijk – set off for Jakarta to buy spices and porcelain. The cargo included silver bullion and ingots.
A devastating storm overtook the ship. The Rooswijk sank on the infamous Goodwin Sands off the coast of England on December 19, 1739, only one day after it set sail. All 300 people aboard perished.
It has been documented that over 1,000 ships wrecked on the notorious Goodwin Sands sandbanks, often called the “great ship swallower.”
In 2004, Ken Welling, a British carpenter, was diving on the Goodwin Sands. He discovered the shipwreck and her treasure an incredible 265 years after the fateful storm.
Archeological salvage operations recovered beautiful Mexican silver dollars, minted just a few years before the shipwreck. Most of the silver found on the ship was returned to the Netherlands, which increases the rarity of the coin we have on offer today.
Other artifacts recovered from the Rooswijk wreck included glass bottles, a fancy wine glass with an air twist stem, thought to have come from the captain’s cabin, pewter jugs, an onion jar, tiles from the cooking stove still scorched by the last meal, three wooden chests and one human thigh bone.
Silver coins were also discovered on the shipwreck that were not part of the official manifest.
While smuggling silver was prohibited by the Dutch East India Company, the large amount of silver found on board that was not part of the official cargo suggests this was a common practice.
Archaeologists believe this shows that some of the Rooswijk’s passengers were smuggling silver to trade illegally, amid high demand for these silver coins around the world. In fact, some coins had holes in them, which suggests the crew sewed them into their clothes to smuggle. Sailors were also known to hide silver in their shoes and belts.
The National Geographic Channel created a show about the Rooswijk and the archeologists who salvaged the treasure in an episode called “Sunken Treasures.”
The Pillar Dollar is not only beautiful, but rich with history.
The Spanish Pillar dollar was widely used in commerce in many countries around the globe. In fact, the Pillar dollar is considered to be the world’s first international currency and was widely accepted due to its minting uniformity.
The coin features two globes, representing the Old and New worlds, between pillars, sitting beneath a crown. The Spanish arms is depicted on the coin’s reverse.
Imagine what it would be like to hold in your hands a coin that sat under the sea for 265 years. You can own it for only $589. See the Mexican 8 Reale here.
5 Things to Know As Gold Bull Run Unfolds
Posted on — Leave a commentHave you ever wondered if gold is a good investment? This is for you.
1. Gold is proving its worth as a safe-haven asset.
In today’s world of stepped-up U.S.-China trade tensions, market-moving Tweets, stock market volatility and economic uncertainty, gold is acting exactly as it should – as a safe-haven investment. Investors around the globe are investing in gold for its ability to diversify and protect portfolio assets.
2. Gold has entered a new bull phase and it’s just getting started.
Gold hit a 6-year high this week and is up over 17% year-to-date (YTD). Gold has chalked up more gains than the S&P 500 YTD.
UBS, a global Swiss bank, recently said it was “staying long gold” with a prediction that gold could hit $1,600 an ounce within three months.
Major Wall Street firms are now citing the potential for gold to climb as high as $2,000 an ounce over the next year. One measure of investor gold demand is gold-backed ETF holdings. In July, gold backed ETF’s added 52 tonnes. The global rush to gold is just getting started.
3. Gold is scoring new all-time highs in other currencies.
Gold hasn’t challenged its all-time high priced in U.S. dollars above $1,900 an ounce. Yet.
Gold has notched new all-time highs in many currencies including the Indian rupee, Australian and Canadian dollar, British pound and Japanese yen.
4. September is a bad month for the stock market.
Seasonally and historically, since 1950 September is the worst performing month of the year for the Dow Jones Industrial Average and the S&P 500, according to Stock Trader’s Almanac. That suggests that stocks are vulnerable to another downswing next month, which could send gold even higher. If you’ve been considering increasing your allocation to tangible assets like gold, current levels still provide an attractive long-term buying opportunity and spot gold could be more expensive next month.
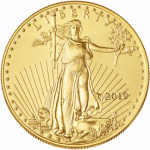
5. American Eagle gold coins are in high demand.
In July, United States Mint bullion sales saw a 10% increase over June of American Eagle gold coins. This coin is one of the most widely traded gold bullion coins around the globe. Investors appreciate the safety and security of American gold eagle coins which provide incredible liquidity (can be sold at a moment’s notice) as well as the opportunity for price appreciation.
Do you have questions about gold investments or how current market conditions could impact your portfolio? Call Blanchard today at 1-800-880-4653 for a confidential and personalized portfolio review and recommendations.
Want to read more? Subscribe to our newsletter and get our tales from the vault, our favorite stories from around the world and the latest tangible assets news delivered to your inbox weekly.
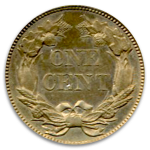
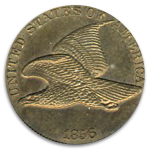
Redesigning Currency with the Flying Eagle Cent
Posted on — Leave a commentIt was the 1850s and the U.S. Mint had a problem. The “large cent,” which was simply a penny, was becoming too expensive to manufacture. The coin was nearly the size of a half dollar and consisted entirely of copper. They needed an alternative.
Officials began working on solutions to the prohibitive cost. Some suggested an annular design. This style of coin has a hole punched in the center. This feature would dramatically reduce the amount of copper needed to manufacture the piece. This idea, however, didn’t last long. The difficulty of punching a hole out of the center proved time-consuming during the minting process. Additionally, officials realized that they would need to expend extra effort and expense to gather the remaining metal left behind from the punching for melting and reuse.
Ultimately, the designers selected an alloy of 88% copper, and 12% nickel, packed into a coin that was about half the size of the original. The design was simple; an eagle on one side and a wreath on the other. Legend has it that the inspiration for the design came from “Peter the Eagle,” an eagle that would frequent the premises of the Philadelphia Mint. Today, Pete’s legacy lives on in more ways than one. He is not only on this piece; his preserved body is on display in Independence Hall in Philadelphia. The wreath is a design element borrowed from Type II gold dollar of 1854, and the three-dollar piece of the same year.
The Flying Eagle cent met with some resistance initially. Tennessee Congressman George Washington Jones expressed dissatisfaction with the coin. He cited the Contract Clause of the Constitution which he interpreted as a mandate that only gold and silver could be used for minting coins. Soon after, New York Congressman Thomas R. Whitney also voiced objections. He believed that a provision in the bill which allowed for the public to commission and design coins was in poor practice and would force the U.S. Mint and private mints into competition. After removing this provision, the bill passed.
By 1857 the coin was available to the public. People were eager to sell their old large cents in exchange for a canvas sack of Flying Eagle Cents totaling $5. In fact, on this first day of availability, the Philadelphia Mint sold nearly 3 million Flying Eagle Cents right on their premises. Over the remainder of the year, millions more were sold.
Despite the coin’s popularity, the piece was short-lived. Broken dies and other manufacturing problems plagued production. The primary problem was that the hard copper-nickel alloy put excessive strain on the equipment. Officials made some modest changes to the height of the relief of the images in an attempt to solve the problem. However, issues persisted and in 1859 the Mint was ready to replace the design. As a result, the earliest 1856 specimens are rare.
Rising Inflation, Slowing Growth Bode Well for Gold
Posted on — Leave a commentIf it seems like everything is getting more expensive, you are right.
In July, the core consumer price index climbed to 2.2% from a year earlier, the Labor Department reported last week.

Clothing rose 0.4%, used car and truck prices surged 0.9% and prescription drug costs increased 0.4%. Planning a trip soon? Airline fares jumped 2.3%. Staying in a hotel? That costs 4.6% more than last year. It doesn’t stop there. Rents edged 0.3% higher in July, but are up 3.5% over the past year.
Gold is up almost 20% since the start of 2019.
Rising inflation is just one more reason gold will continue to climb. Gold is a traditional hedge and historically rises during periods with rising inflation. Investing a portion of your assets into physical gold, especially during inflationary times, protects your wealth and your purchasing power.
Adding into the bullish brew for gold, the U.S. economy is showing signs of slowing. In fact, a reliable recession indicator (inverted yield curve) flashed last week in the bond market. This paves the way for even more gains in gold ahead.
The Federal Reserve already cut interest rates once this year. They’re worried the trade war with China will slow the U.S. economy.
The Fed is intent on lowering rates, maybe even again in September, in an effort to keep the aging economic expansion growing. That may sound like a good idea. But, it also shows the Fed is abandoning its fight against inflation. In a normal environment, the Fed would increase interest rates to tamp down inflation. Don’t expect that anytime soon.
That all adds up to higher prices ahead. Numerous reports have shown that the trade war is already causing the prices of everyday good to climb. With more tariffs on the way, that just means even higher prices for everyday Americans.
While you can’t control the trade war, or the Fed or the economy, you can control your investments. This the perfect time to increase your allocation to tangible assets like gold bullion. The trend is up, with some Wall Street firms targeting new all-time highs in gold at $2,000 an ounce.
Independent researchers at Penn State University found that rare coins are an even better hedge against inflation than gold. Risk averse investors typically want to arrange their portfolios in a manner that reduces volatility without giving up overall return.
Coins and gold both have low betas. Long-term average returns on gold and rare coins reveals that investors holding both tangible assets would have reduced the volatility of typical portfolios without sacrificing overall return. Looking ahead, the mounting concerns about global recession, rising inflation, and an aging stock market cycle the low betas suggest rare coins and gold are likely to outperform equities over the next two to three years. Are you ready?
Want to keep up to date on the latest market news and rare coin reports? Sign up for our newsletter here.
Who Wins In A Currency War?
Posted on — Leave a commentDon’t look now, but the trade war is turning into a currency war.
This month, the United States labeled China a “Currency Manipulator,” turning the tensions between the world’s two largest economies to a boil.

U.S. Treasury Secretary, Steven Mnuchin, accused China of manipulating its currency “to gain unfair competitive advantage in international trade”. Now, the U.S. will turn to the International Monetary Fund to “eliminate the unfair competitive advantage created by China’s latest actions”.
Earlier this month, the Chinese currency – the yuan – tumbled below 7 per U.S. dollars, marking an 11-year low.
“The drop suggests that the central bank of China is willing to weaponize the currency in light of the trade war,” Andrew Collier, managing director of Orient Capital Research in Hong Kong said in news reports.
Countries benefit from weaker currencies as it makes the cost of their exports cheaper to foreign buyers, and thus stimulates demand for their goods and economic growth.
It’s not just China that wants a weaker currency.
President Trump has tweeted his demands for a weaker U.S. dollar and has publicly called for lower interest rates from the Fed, which does push the dollar lower.
While the value of a nation’s currency may seem a bit esoteric, this is a significant development.
Students of history may remember the last time we had a global competitive devaluation was in the 1930’s. Yep, the Great Depression.
As the global economy began slowing in 1930, countries began slapping tariffs on imports to protect their own country’s interests. The most famous, or infamous, is the Smoot-Hawley Tariff passed by the U.S. Congress which imposed tariffs on many imported goods.
“But each move – devaluations, tariffs, and other attempts to level the playing field – led to more retaliation. In the single year that elapsed between the third quarter of 1931 and 1932, world trade declined 16 percent. One historian described the series of events as an “uncoordinated break-up” of the global currency regime,” according to Bloomberg.
Sound familiar? Tit for tat rarely ends well.
You remember what happened next. The Great Depression.
Fast forward to today.
Britain is on the brink of moving out of the European Union, which will trigger a massive devaluation of the pound versus the euro.
The United States and China are already lobbing currency strikes, each government attempting to push its currency lower.
As all these major global currencies like the dollar, the yuan and the pound weaken, it will force other countries around the globe to join in the devaluation to avoid turning their exports into a standstill.
The United States and China trade war lit a match. That fire is getting bigger and harder to control.
As countries race to lower their currencies, the only winner is gold and investors who own gold.
Gold remains the world’s premier safe-haven asset. Gold is a global currency without any of the obligations, debts or deficits that come along with the U.S. dollar or any other currency.
While countries debase and manipulate their fiat currencies, gold is climbing – up nearly 20% this year. Goldman has a six-month forecast of gold at $1,600. Citi sees the same rise to $1,600 in six months to a year, and Bank of America Merrill Lynch sees prices climbing toward $2,000 within two years, topping the record of $1,921.17 reached in 2011.
The trade war and the developing currency war will get worse before they get better. While the U.S. Administration is beholden to two four-year limits on presidential power, the Chinese government has no constraints. They are in for the long game.
Consider increasing your allocation to gold, a hard asset that is climbing in value, not falling, and is safe from government or central bank manipulation.
The only winners in a currency war are those who own gold.
Call Blanchard today at 1-800-880-4653 to learn the optimal amount of gold you should hold in your portfolio.
Blanchard Built Steinbrenner Collection Results in $6.1 Million Total Sale
Posted on — Leave a commentNEW ORLEANS, LA, August 15, 2019 – – Blanchard and Company, the nation’s leading tangible asset firm, today affirms numismatic history was made with this week’s public auction of the Joan Zieg Steinbrenner coin set, which includes some of the finest gold type coins ever assembled.
Over a 25-year period, Blanchard advised Mrs. Steinbrenner and through its deep numismatic connections sourced for her a historic collection of U.S. gold coins.
Mrs. Steinbrenner is remembered for her active philanthropic contributions until her passing in December 2018. Her husband George purchased the New York Yankees in 1973.
This week, 44 lots from her collection were presented at public auction, all coins Blanchard placed with Mrs. Steinbrenner, which sold for a collective $6.1 million.
Blanchard originally placed in 2009 an 1843 $2.50, $5 and $10 three-coin gold proof set with Mrs. Steinbrenner that was pedigreed to legendary coin collector John Jay Pittman. This week’s auction broke up the set and the three coins sold for a cumulative total of $1,032,000.
Another notable sale included the finest ever to come to auction: MS68 1907 $10 Indian Wire Rim, which sold for $432,000 on August 14.
Commenting on the sale results, “It represents her belief that when you acquire the highest quality that fits within your budget, you can’t go wrong. That’s what paid off for her. It was a legacy she built for her family and they were able to do with it as they pleased,” David Zanca, senior portfolio manager at Blanchard.
Mrs. Steinbrenner originally consulted with Blanchard with a goal of diversifying in tangible assets. “She had no knowledge of numismatics. Over a 25-year period, through the relationship we built, my expertise and Blanchard’s deep connections in the numismatic community, she was able to build one of the finest collections ever created as a legacy for her family,” Zanca said.
“Some of these coins are once in a lifetime coins that we may never see hit the market again,” Zanca said.
The long-term relationship between Blanchard and her family spans over 40 years. Mrs. Steinbrenner’s father recommended his daughter work with Blanchard and she consulted exclusively with Mr. Zanca for 25 years.
Mrs. Steinbrenner began with a goal to diversify a portion of her portfolio in tangible assets due to concerns over world-wide debt and currency problems. “She wanted a portion of her investments in real and tangible, something she could see, touch and hold. Her father was a hard money guy. He had lived through the Depression and believed in real tangible assets,” Zanca said.
Through a trusted, personal relationship built over 25 years, Zanca listened, learned her individual goals and created numismatic recommendations based on exactly what she wanted to accomplish.
The one rule of thumb Mrs. Steinbrenner lived by was to always acquire the highest quality that fits in your budget and you will never be disappointed.
“She always wanted the finest available,” Zanca said. “She never second guessed anything because she knew she was acquiring the best.”
In addition to the diversification and legacy she built for her family, Mrs. Steinbrenner developed a true love for the beauty and wonder of numismatics. Her favorite coin was the 1907 $20 Saint Gaudens High Relief.
“It was absolutely her favorite coin. She owned multiples in varying grades. She had one made into a necklace because she loved it so much. She loved the beauty of these coins so much,” Zanca said.
Other outstanding coins included in this week’s auction of the Steinbrenner collection included the 1837 $2.50 PR66+ Deep Cameo, 1843 $5 PR66 Ultra Cameo, 1843 $10 PR64 Deep Cameo and 1843 $2 1/2 PR66 Ultra Cameo.
About Blanchard and Company
Founded in 1975, Blanchard and Company is the largest and most respected investment firm in the U.S. that specializes in precious metals and rare coins. Headquartered in New Orleans, Blanchard has owned and sold more than half of the published 100 Greatest U.S. Coins with over $1 billion in sales in the last three years alone. With over 450,000 customers to date, Blanchard has provided investors and collectors with the expert consultation they need to strategically acquire American numismatic rarities and gold, silver, platinum and palladium bullion.
David Zanca, with Blanchard since 1993, has handled some of the finest rarities in the world and works with any size collector and investor. Mr. Zanca is available at 1-800-880-4653 or via email at [email protected].
MEDIA CONTACT:
Sarah Munson
1-800-880-4653


