


Gold Loves Bad News
Posted on — Leave a commentUnfortunately, many investors today see plenty of bad news no matter where they look.
Consequently, more people are considering how an investment in gold can buoy their portfolio. For this reason, it is important to understand the nature of gold during periods of economic uncertainty. Research published in the Journal of Banking & Finance offers some answers.
The researchers explored a 30-year period spanning 1979 to 2009. Their findings reveal one simple truth: “gold loves bad news.”
However, their work also underscores some of the unseen characteristics of gold in a crisis. These are three key takeaways:
Gold Tends to Work Best as a Haven in Developed Countries
The researchers note that “gold was a strong safe haven for most developed markets during the peak of the recent financial crisis.” However, the effect is less pronounced in emerging markets. Despite this difference the researchers conclude that gold “has the potential to act as a stabilizing force for the global financial system by reducing losses when it is most needed” because the haven effect is present not only in the US but also in Eurozone markets. The researchers also offer one hypothesis that might explain the reduced safe haven effect in emerging markets. They suggest investors likely liquidate their emerging market investments during periods of declining performance and purchase equities in developed markets instead.
The Word “Haven” Is Frequently Misunderstand
The word “haven” and “hedge” are sometimes used interchangeably. The differences between the two, however, are considerable. The researchers explain that a hedge is an asset that is negatively correlated with another asset in the same portfolio on average. This description is different than a haven asset which is also negatively correlated with another asset in a given portfolio but only in certain periods like a downturn. What this distinction tells us is that the two words represent two different periods. A hedge relates to the long term, while a haven relates to the short term. When forming an investment selection, it is important to be aware of this difference when an asset is labeled as either a hedge or a haven.
Specific and General Uncertainty Have Important Distinctions
Most market uncertainty can be classified as either “specific” or “general.” Specific uncertainty emerges from a narrowly defined event. In contrast, general uncertainty refers to any uncertainty that is not connected to one particular event. This difference matters because the researchers focused their study on gold movements during periods of general uncertainty. They learned that a rise in general uncertainty often increases investor interest in gold. However, when this uncertainty becomes extreme, gold has a higher probability of moving in the same direction as equity markets.
The evidence is clear…gold plays a valuable role in a portfolio designed to weather the unforeseen and periods of uncertainty. Investors should take the time to understand the nuances of gold’s performance during downturns in equity markets. The country, the duration, and the type of uncertainty are all important factors.
Want to read more? Subscribe to the Blanchard Newsletter and get our tales from the vault, our favorite stories from around the world and the latest tangible assets news delivered to your inbox weekly.
Gold Delivers on Its Enduring Status as a Safe-Haven
Posted on — Leave a commentUsing a baseball analogy, 2022 threw Americans a lot of curve balls that no one was expecting. We’ve seen gasoline rocket above $6 a gallon, mortgage rates soar from 3% last year to 6% today and the stock market tumble over 20%. Everyday goods simply cost more with inflation at a 40-year high. The cryptocurrency market collapsed – with  Bitcoin falling from over $67,000 in late 2021 to just over $17,000 last week.
Amidst the market turmoil, gold has delivered as a solid safe-haven investment – and is one of the year’s best performing asset classes.
Gold is up about 1% in late June – and is holding up vastly better than other assets classes which are down a staggering 20% to 70% from their peaks.
This is a reminder of why allocating a portion of your portfolio to gold pays off. Investors who own gold have seen more stability in their portfolio, with less drawdowns than those without gold exposure. Gold is acting as a store of value to protect your wealth.
With the S&P 500 now officially in a bear market, Wall Street analysts are warning the stock market rout could still get worse before it gets better. Société Générale issued a research note this week stating that if the Federal Reserve fails to tame inflation an economic recession could push the S&P 500 down another 33%.
And what about gold? Increasing your allocation to gold now is an option to preserve and protect your wealth.
One of the factors holding the gold market steady right now – is the strong U.S. dollar. Gold and the dollar often trade inversely – so the current strength in the dollar is a headwind for the precious metals. The U.S. dollar index is up around 9% year-to-date.
However, eventually the dollar rally will stall and “that is when the gold price will take off,” Will Rhind, founder and CEO of ETF provide Granite Shares told Barron’s.
Indeed, earlier in June, Goldman Sachs released a new report stating: “We expect a rebound in emerging market gold demand in the second half of the year. In the absence of a large liquidity shock, we view current gold price weakness as a good entry point.”
Do you have cash on the sidelines ready to go to work? Preserve and protect your wealth with gold. Goldman Sachs issued 3- and 6-month targets at $2,100 and $2,300, respectively. In 12 months, the bank expects gold to reach $2,500.
Precious metals are an insurance policy that has consistently paid off for investors in all types of market cycles, and we are seeing that happen again today.
Want to read more? Subscribe to the Blanchard Newsletter and get our tales from the vault, our favorite stories from around the world and the latest tangible assets news delivered to your inbox weekly.
Investors Relearn the Meaning of “Hedge”
Posted on — Leave a commentCrypto was supposed to be a hedge against uncertainty, inflation, and bear markets. However, in 2022 alone, Bitcoin has lost more than half of it’s value. Does cryptocurrency have the staying power of an investment class?

These losses are not restricted to Bitcoin. Solana, Etherium and Litecoin have all experienced massive drops year to date. This fall in value across cryptocurrencies has been sobering for investors who long believed blockchain technology would deliver stability and gains over the long-term.
Ipek Ozkardeskaya, an analyst with Swissquote remarked that “it is now clear that Bitcoin trades parallel to the risk assets, rather than [as] a safe haven.” He continued, “Bitcoin is still not the digital gold, it’s more of a crypto-proxy for Nasdaq.”
While plummeting cryptocurrency prices have dominated recent headlines there is another, less discussed reality taking hold. After more than a decade, Bitcoin and other similar currencies have failed to generate the broad based appeal so many expected. The crash in values in 2022 likely signal that cryptocurrency will not reach the heights so many anticipated.
In the meantime, investors are rediscovering the value of tangible gold in the current setting of inflation, uncertainty, and global tensions. This renewed interest comes from the widely held belief that gold presents about one quarter of the volatility seen in cryptocurrency, and stocks. As a result it seems that Bitcoin may not graduate from it’s current status as a speculative asset.
This is a problem for cryptocurrencies because its independence from traditional equity and bond markets has always been part of its appeal. The current market, however, is proving something different; cryptocurrencies appear susceptible to the same factors that are currently driving down stocks.
Moreover, these influencing factors are unlikely to improve any time soon. The US government has a long way to go before taming inflation and the war in Ukraine shows no end in sight. At the same time, supply chain woes are still hampering many businesses across the globe. Resolving these systemic problems will almost certainly require the start of a new economic cycle. This process will take time.
Consider that The National Bureau of Economic Research (NBER) has still not formally declared that the US is in a recession. The NBER currently defines a recession as a decline in activity across the economy for a period of several months. This drop in activity includes employment, industrial production, real income, and wholesale-retail sails. The bottom line: We are almost certainly in a recession now, but we are at such an early stage of it that it has not even been formally declared yet.
No one can predict what will happen with cryptocurrency in the coming quarters or years. What we do know is that in the last thirteen years it has fallen short of expectations. Bitcoin has not yet ushered in a new era of blockchain dominance and may never. Gold, in contrast, continues to enjoy worldwide demand and reduced volatility amid uncertainty.
Want to read more? Subscribe to the Blanchard Newsletter and get our tales from the vault, our favorite stories from around the world and the latest tangible assets news delivered to your inbox weekly.
The Gold Dollar: An Early American Currency Workhorse
Posted on — 1 CommentThroughout the history of civilization, gold has served as money – longer than any other material. In the early days of our union, the American government worked to create a gold dollar as a unit of currency. Indeed, as early as 1791, Secretary of the Treasury Alexander Hamilton first called for a one-dollar denomination gold coin. Yet, it took our young nation 58 years to actually mint the one-dollar gold coin.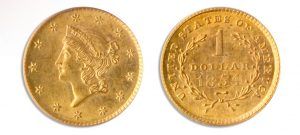
Finally, with the Act of March 3, 1849, Congress authorized the production of the gold dollar and they were minted from 1849 through 1889.
The $1 Liberty Head gold coin is a special rarity and an outstanding example of pre-1934 gold U.S. coinage. There are three gold dollar types and Type 1 reveals the smallest diameter of any United States coin minted to date. In 1854, the design was updated to a feather headdress on the female, which is called the Indian Princess Head (Type 2). In 1856, the type was changed again to increase the size of the head (Type 3).
All three types were designed by Mint Chief Engraver James B. Longacre, who also designed the Indian Head cent and two-cent coins.
In the early years of its minting and up until he Civil War, the gold dollar was widely used in everyday commerce. That’s why most specimens you will find today show evidence of wear. Just imagine what these coins minted were used for – a knapsack, wool socks, a belt, a comb, soap, matches, a handkerchief, a harmonica, food, medicine or even whisky.
Once the Civil War began in 1865, however, amid the economic destruction of the war, gold dollars nearly vanished from circulation. Gold did not circulate widely again in much of the country until 1879.
Collectors today often seek to acquire one from each of the three different gold dollar design variations. Generally speaking, the scarcest is the Type 2.
Collecting gold dollars can be an exciting goal – though it will give collectors a challenge. Some of the harder coins to source include Charlotte and Dahlonega mint coins, with 1855-D, 1856-D, 1860-D, and 1861-D seen as prime rarities. From the Philadelphia Mint coins the important date is the 1875, of which just 20 Proofs and 400 business strikes were minted.
One numismatic strategy to acquire gold dollars is to build a type set. One could consider acquiring a gold type set, which would include the major design types from the mid-19th century forward: three types of gold dollars, Liberty Head or Coronet quarter eagle and Indian quarter eagle, $3 gold, Liberty Head half eagle, Indian head half eagle, Liberty Head $10, Indian $10, Liberty Head $20, and Saint-Gaudens $20 gold coins.
Historically, one of the best ways to invest in rare coins is to build a set. Often sets become more valuable than the sum of the individual coins. If you are interested in starting a set or are looking for an elusive coin to complete a set, contact a Blanchard portfolio manager today for guidance. Over the past 40 years, we have helped clients build simple and elaborate sets to help meet their financial goals. We can help you too.
Want to read more? Subscribe to the Blanchard Newsletter and get our tales from the vault, our favorite stories from around the world and the latest tangible assets news delivered to your inbox weekly.
Gold and Gold Bugs
Posted on — 1 CommentIn March 1933, the Federal Reserve Bank of New York could no longer honor its commitment to convert paper money to gold and FDR declared a banking holiday. FDR issued an Executive Order requiring all Americans to surrender all gold owned by them to a Federal Reserve bank and prohibited the  private holdings of all gold coins and bullion. President Roosevelt ordered Americans to sell their gold back to the government, or face jail time and fines.
It was only 40 years later, thanks in large part to the advocacy of our company’s founder, Jim Blanchard, that the right of private citizens to own gold was restored. Through their National Committee to Legalize Gold, Jim and his wife Jackie held public demonstrations where they brandished bars of gold, daring the feds to arrest them.
Blanchard hired a WWI-style biplane to fly near President Nixon’s second inauguration with a banner that read “LEGALIZE GOLD!” prompting the Secret Service to scramble a military plane to tail the pilot and warn him off course (intended to be directly over the inauguration). All three national network TV news programs commented on the banner that night, and the story was picked up by all the wire services.
The Blanchards also held “Gold Tea Parties,” during which they carried pro-gold banners around and either dumped paper money into bodies of water or set it on fire, depending on the surroundings.
President Ford was persuaded to legalize gold after seeing a television commercial of Blanchard, who held a bar of gold and asked, “Why can I not own this?”
“G-Day,” as Jim Blanchard called it, finally arrived, and December 31, 1974 made history as the first day of legal gold trading in America.
Thanks to Jim, the gold bug who wouldn’t quit, you can own gold today. It is your right!
Want to read more? Subscribe to the Blanchard Newsletter and get our tales from the vault, our favorite stories from around the world and the latest tangible assets news delivered to your inbox weekly.
The Modern Look of the Braided Half Cent
Posted on — Leave a commentThe Braided Hair Half Cent is one of the most collectable coins ever issued by the US Mint.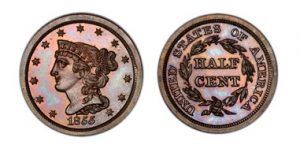
The coin, first minted in 1793, was the smallest denomination ever minted and is part of a series consisting of five major types and subtypes which are each part of a series of varieties. This vast array presents collectors with an opportunity to own a diverse set of coins that are all within the same family.
The Braided Hair Half Cent was the last of the varieties and is largely the work of Chief Engraver Christian Gobrecht who evolved the design from the Classic Head image to the more youthful braided hair look.
Officials authorized the coin as part of the Coinage Act of 1792. The US minted the coin, which consisted of 100% copper, between 1793 and 1857. The coin carried a value of just one two-hundredth of a dollar. It was nearly the size of today’s quarters.
The first variety was the Liberty Cap showing Lady Liberty’s profile facing left. Henry Voigt designed and engraved the piece. Following this coin was the Liberty Cap variety issued just one year later. Chief Engraver Robert Scot designed the imagery. Scot is also remembered for designing the famous Draped Bust coin and Flowing Hair dollar. His Liberty Cap design continues until 1797 when engravers Gilbert Stuart, and Scot-John Gardner worked with Robert Scot to create the Draped Bust design. The US Mint issued this version in 1800 and continued to mint it until 1808.
The last version to be designed before the Braided Hair issuance was the Classic Head minted from 1809 to 1836. The Classic Head has a strong resemblance to the Braided Hair that follows. Lady Liberty’s profile faces left and has a hair style that is somewhat similar to the Braided Hair coin first issued in 1840.
The US Congress officially ended the minting of half cent coinage with the Coinage Act of 1857. This decision was the result of a shifting economic setting in which the value of the coin was less than the cost of production. Moreover, the utility of a half cent was too low for most consumers. Towards the end of their run the coins were valued more for their metal content than their buying power.
Today the coins are one of many enduring works from Gobrecht who was born in Hanover, Pennsylvania and got his start as a watchmaker apprentice. This introduction into fine craftsmanship is what ultimately led him to the engraving work that he is remembered for. One of his works even carries his name, the Gobrecht dollar, struck from 1836 to 1838, is a beautiful piece showing Liberty in a seated position with a shield.
His work appeared on almost every denomination from the US Mint. He was Chief Engraver for four years. He died in 1844.
The mint quantities for the Braided Hair half dollar were low with the highest minting reaching only 147,672 pieces in 1851. The majority of the other issues were in quantities of approximately 50,000.
Want to read more? Subscribe to the Blanchard Newsletter and get our tales from the vault, our favorite stories from around the world and the latest tangible assets news delivered to your inbox weekly.
How Long Can Bear Markets Last?
Posted on — Leave a commentAmerican investors can have short memories – especially when it comes to bear markets. In stock market lingo, a bear market is defined as a decline of 20% or more.

You may remember that we suffered a Covid-inspired bear market in stocks in 2020. But, it was one of the shortest bear markets in history. After plunging 20% into the March 2020 low, the U.S. stock market fully recovered to pre-crash levels in just four months.
That’s not a normal bear market.
Let’s look back in stock market history to explore other bear markets.
There have been eight bear markets going back to the infamous 1929 stock market crash. That devastating bear market took almost three years (34 months) to hit bottom, with a total decline of 83%. It took 25 years for the Dow Jones Industrial Average to recover to its previous peak. That’s right a quarter of a century.
More recently, during the 2008 Global Financial Crisis, the U.S. stock market lost a whopping 51% between November 2007 and February 2009. From there – it took 37 months (over three years) for the stock market to get back to even.
Taking a look at all eight bear markets since 1929, it took on average 57 months for the stock market to get back to even – or almost five years.
That’s why you may have heard the conventional advice about not putting money you may need within five years in the stock market.
Yet, Americans over the past 100 years have been conditioned to believe the stock market will recover and continue to go up. Is that true?
The Japanese know a different reality about stock market recoveries. While the U.S. stock market has recovered from its downturns over the past 100 years – that’s not true in Japan.
In fact, since 1989, Japanese stock market investors still haven’t gotten back to break-even levels after a major stock market bubble popped. That’s right…for the past 33 years Japanese investors who had money in the Nikkei stock index in 1989 have seen negative returns.
We cannot necessarily count on the U.S. stock market coming back – just look at Japan. At some point the piper will need to be paid. The mounting levels of U.S. government debt – now at an all-time record high of $30 trillion – and the Fed’s role as money printer and buyer and lender of last resort – will eventually have consequences.
The case for diversification into tangible assets like gold and silver is rising every day. Major firms from Bank of America to Wells Fargo project further gold gains in 2022.
The lesson from Japan is a painful one – and one that is foreign to American investors.
Consider how your investment accounts would look if, 33 years later, the S&P 500 still hadn’t recovered from this year’s market crash? What would that mean to your retirement? What would that mean to you and your family’s financial security?
Gold is a powerful tool to diversify your portfolio and to protect and grow your wealth.
Do you own enough?
Want to read more? Subscribe to the Blanchard Newsletter and get our tales from the vault, our favorite stories from around the world and the latest tangible assets news delivered to your inbox weekly.
Rise of the Machines
Posted on — Leave a commentSitting through a red light, watching a commercial, and drinking a cup of coffee are all things that last longer than the average amount of time a stock is held in the US.

Research published in The Telegraph shows that in the US “the average share holding lasts just 22 seconds.” Incredibly, this is not the shortest time on record. In other periods, this duration as been 20 seconds.
Despite the conventional wisdom that “buy-and-hold” is the most effective investing strategy, it seems few people put it to work. Michael Hudson, a former Wall Street economist at Chase Manhattan Bank, explains that these short holding periods occur among other asset classes. He remarked, “The average foreign currency investment lasts – it’s up now to 30 seconds, up from 28 seconds last month.”
It seems everyone is in a rush. This accelerated timeline can be seen outside finance. Research from the Federal Reserve Bank of St. Louis shows that the “average job tenure steadily declined, from 9.2 years in 1983 to 8.6 years in 1998.”
It is likely that high frequency trading (HFT) is the primary cause of the rapid fire buy and sell cadence of stocks today. In fact, data shows that HFT might account for up to 70% of all equity trades. This finding agrees with additional research from JPMorgan which shows an alarming statistic: an estimated 10% of all trades are made by a person logging on and executing a transaction like an ordinary person. The rest are automated.
This finding is not new. Major firms like JPMorgan have seen this phenomenon for years. More of the general public is awakening to this reality as headlines like those about Twitter reach the front page. People are learning that automation represent more of our lives than previously thought as Elon Musk suggests that a significant portion of Twitter accounts are in fact artificial and governed by algorithms.
In this setting even a disciplined buy-and-hold investor is subject to the constant turnover of shares resulting from incessant transactions. Finding stability means finding other asset classes.
Gold is one solution because its value is not as influenced by trading as equities are. Consider research from Joerg Picard who learned that ETF gold trades, which can be traded as easily as HFT equities, “do not contribute much to price discovery.” This should be welcome news to investors looking for a counterbalance against the increasing volatility in today’s market.
It is getting harder to win in today’s equity market because investors must battle more than economic cycles, interest rate changes, and geopolitical tensions. Now, they must also face the threat of HFT. Regaining control means allocating cash to assets like gold which are not nearly as influenced as equities.
Want to read more? Subscribe to the Blanchard Newsletter and get our tales from the vault, our favorite stories from around the world and the latest tangible assets news delivered to your inbox weekly.
What Movements in the Fear Index Can Tell Us About Gold
Posted on — 1 CommentVolatility came roaring back to the market this year. The S&P 500 has fallen more than 15% since the start of January. Many analysts cite the Fed’s decision to raise rates as the major contributor to this drop.

This move means that the flow of cheap money is slowing significantly. The result is a higher cost of doing business.
Meanwhile, many investors who long believed that stock valuations were unreasonably high are starting to see their fears confirmed. More people are looking to different asset classes as a means for preserving wealth as equities drop in value and investor sentiment dampens.
Doing so is especially important in a rising cost environment. As inflation exceed 8% more Americans are considering ways to buoy the spending power of their dollar as gas, groceries, and housing costs all rise.
This setting has prompted renewed interest in gold. “Historically gold has outperformed equities by an even larger magnitude when volatility is rising from an already elevated level,” explained CFA Russ Koesterich at BlackRock.
This same body of research concluded that changes in the VIX, often called the “fear index,” explains almost 20% of the difference between the return offered by gold and the S&P 500.
Put another way, during months of rising volatility in the S&P 500 gold outperformed the market by approximately 2% on average. Moreover, this relationship becomes even more stark when the VIX rises above 20. During these times, gold outperformed the S&P 500 by an average of about 5%.
Today the VIX is at more than 29.
This research confirms the long-held notion that gold can have a stabilizing effect on a portfolio because its correlation to equities is low. In fact, the correlation between gold and equities is lower than that of the correlation between the stock market and REITs, private equity, and hedge funds.
The low correlation between gold and US stocks was evident during other periods of upheaval including the Long-Term Capital Management crisis, the September 11th terrorist attacks, the 2008 Global Financial Crisis, and Brexit, during which gold climbed 9.8% and global equities fell 1.2%.
The volatility in today’s market is unlikely to decrease any time soon. Investors and markets are concerned with the war in Ukraine, rising COVID transmission in China, more interest rate hikes to come, and of course the highest inflation we have experienced in more than forty years.
Solving many of these structural problems will take time. Companies will need to shore up their operations as a safeguard against existing and future supply chain disruptions. The global food system will need to adjust to the lack of agricultural products, namely wheat, coming from Ukraine. Additionally, investors will need to wait out the inflation problem.
In the meantime, gold offers a hedge against uncertainty.
Want to read more? Subscribe to the Blanchard Newsletter and get our tales from the vault, our favorite stories from around the world and the latest tangible assets news delivered to your inbox weekly.
Is America Barreling Toward A Debt Crisis?
Posted on — Leave a commentStudents of market history know that it’s not a question of will there be another financial crisis – but when will it occur and what will be the trigger. History is littered with market bubbles that burst and the crises that followed.

Walter Bagehot, editor of the Economist between 1860 and 1877, once stated that financial panics develop when the “blind capital” of the public floods into unwise speculative investments. Today’s cryptocurrency market collapse could be a prime example of that. Going farther back in recent history – the 2001 dot.com crash emerged after the public chased after and bought a variety of new technology companies that had zero profits – only potential.
Then of course, the 1929 stock market crash and subsequent Great Depression looms large in the economic history books. The stock market was booming in the late 1920’s as new companies embraced the technologies of the day including radios, aluminum and airplanes. Yet, few of these companies had a performance track record or dividend payments. However, speculators fueled by the fear of missing out (FOMO) drove the market ever higher. In October 1929, the speculative rally began to unravel with a nearly 25% drop in the Dow.
By November, the Dow had crashed 45%. In the wake of the 1929 market crash, banks failed and America entered an economic Depression that lasted ten years.
History shows that bubbles and crises are repeating patterns
From the Dutch Tulip mania in 1637 to the South Seas Bubble in the UK in 1720 to the more recent 1987 Black Monday stock market crash and the 2008 Global Financial Crisis, they are easy to find.
Sometimes crises are triggered by Black Swan events that you simply couldn’t see coming. Other times, crises build up over time, quietly in the background. That is what we are seeing today.
America is slowing but surely grinding toward a major debt-inspired fiscal crisis
Many can see it coming and some ring warning bells. But, our nation’s debt feels so esoteric, so vastly huge that it becomes meaningless to the average American.
A recent Wall Street Journal article headlined: CBO Sounds a Warning of American Fiscal Ruin is another attempt to highlight this ticking time bomb that lurks behind the scenes of our daily lives.
Our nation’s national debt recently passed the $30 trillion mark, according to Treasury.gov
See Total Public Debt Outstanding here. The debt load simply keeps climbing.
So what could lie ahead? The non-partisan Congressional Budget Office (CBO) warned in a new report that you may face two scenarios in the years ahead.
Spoiler alert. Neither scenario is pretty. Get ready for higher taxes and lower benefits.
“The first would gradually raise personal income-tax rates in equal proportion across the income spectrum. The second would gradually reduce benefit payments for Social Security, Medicare, Medicaid, and ObamaCare. The budget gnomes analyzed each scenario with three different starting dates, with fiscal tightening beginning in 2026, 2031 or 2036,” according to the Wall Street Journal article.
No surprise: the longer your representatives in Congress take to deal with this situations, the larger the tax increases and benefit reductions will be needed, the CBO said.
While higher taxes and lower Social Security and Medicare benefits sound bad, the alternative is even worse.
A debt-driven U.S. fiscal crisis in the future has the possibility of completely upending our way of life, our markets, interest rates, the dollar and our financial system as you know it.
Here’s what the CBO report said:
“The likelihood of a fiscal crisis increases as federal debt continues to rise in relation to GDP, because mounting federal debt could erode investors’ confidence in the government’s fiscal position and result in a sharp reduction in their valuation of Treasury securities. In turn, investors would demand higher yields to purchase Treasury securities and thus drive up interest rates on federal debt. Additionally, concerns about the U.S. government’s fiscal position could lead to a sudden increase in inflation expectations, fear of a large decrease in the value of the U.S. dollar, or a loss of confidence in the federal government’s ability to repay its debt in full, all of which would make a fiscal crisis more likely.”
This crisis would be a dollar crisis
If that were to unfold, your dollars would decrease in value by an exponential basis. Think it won’t happen? How confident are you in your lawmakers in Washington D.C. to work together, across the aisle, in a collaborative manner – making compromises – to achieve a deal to stabilize the nation’s finances. Too many politicians today are willing to gamble with significant financial issues in order to create news that will go viral in a social media world.
Gold offers you protection, yet again
If this day comes, investors holding an allocation to gold will have diversification and protection from a collapse in the U.S. currency, the dollar. Gold and silver are monetary metals that are recognized and valued in every country on earth. While the policymakers in Washington play politics with your hard earned paper dollars, tangible asset investors have a strategy to shield a portion of their wealth by investing in good old fashioned hard currency – gold.
Investors diversify into precious metals for many reasons. The looming fiscal crisis is simply another one to add to your list.
Want to read more? Subscribe to the Blanchard Newsletter and get our tales from the vault, our favorite stories from around the world and the latest tangible assets news delivered to your inbox weekly.


