


Press Release: Blanchard Built Zito Family Collection Results in two auction records being shattered!
Posted on — Leave a commentNEW ORLEANS, LA, April 6, 2022 – Blanchard and Company, the nation’s leading tangible asset firm, made numismatic history again following this week’s public auction of the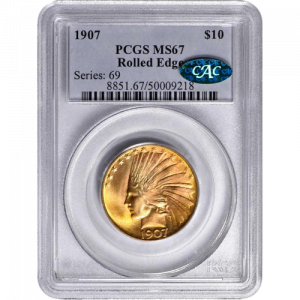 Zito family collection.
Included were two 1907 $10 Indian pieces that shattered previous auction records. These coins, an NGC MS68 1907 $10 Indian Wire Edge and a CAC PCGS MS67 1907 Rolled Edge, both sold at nearly double their previous record highs.
Over an eight-year period, Blanchard advised the late Dr. Paul Zito, a medical doctor from New York, and his wife Rosalie. Through Blanchard’s deep numismatic connections, the firm sourced for them a historic collection of 92 U.S. gold and silver coins.
This week, 89 lots from their collection were presented at public auction and sold for over $4.3 million. Blanchard helped the Zito family to achieve their goal to diversify their portfolio with a collection of high-quality and ultra-rare tangible assets.
Investors quickly bid on the rare U.S. gold and silver coins once they became available and the entire collection sold immediately. “This underscores the high demand and limited supply for ultra-rare numismatics in today’s environment with inflation at 40-year highs, expansive monetary policies and a slowing U.S. economy,” said David Zanca, Senior Portfolio Manager at Blanchard, who worked with the Zito family over 8 years to build this fabulous collection.
The start of the current boom in rare coin demand can be traced to the beginning of the pandemic in 2020, which triggered a renewed interest in tangible assets, including rare coins. Both the number of sales of rare coins and the prices paid for rarities exploded higher over the past two years industry wide.
The NGC MS68 1907 $10 Indian Wire Edge is tied with one other at MS68. Interestingly, the other MS68 is the Steinbrenner coin, also placed by Zanca. Until the Zito piece was placed last evening, the Steinbrenner coin held the auction record, having sold in August 2019 for $432,000. Now, not even three years later, the Zito piece set a new record having sold at nearly double the prior record at $840,000.
One lot later, the CAC PCGS MS67 1907 $10 Indian Rolled Edge made its own bit of history by shattering its previous record price. The Zito piece is tied with the Pogue coin as the finest known within the CAC population. Just two years ago the Pogue coin was placed at $576,000. The Zito piece blasted past that number and settled at $1,140,000.
“It’s incredibly satisfying to see the results for these long-term clients. Seeing the Steinbrenner Wire Edge break the record at $425,000 in 2019 was amazing. Now, not even three years later to see another of my clients’ pieces nearly double that record is a testament to what is happening in the rare coin market. As to the Rolled Edge, seeing a client realize well over $1 million for a coin is just wonderful. It proves that if an investor acquires quality and sticks with a plan that, literally, world records can be broken.”
Other outstanding coins sourced by Blanchard from the Zito collection include:
- 1795 Draped Bust Silver Dollar. BB-52, B-15. Rarity-8 as a Specimen. Centered Bust. Specimen-65
- 1799 Draped Bust Silver Dollar. BB-163, B-10. Rarity-2. MS-63 (NGC). OH.
- 1832 Capped Head Left Quarter Eagle. BD-1, the only known dies. Rarity-4. MS-63 (NGC).
- 1863 Three-Dollar Gold Piece. JD-1, the only known dies. Rarity-6+. Proof-64 Cameo (NGC). CAC.
- 1799 Capped Bust Right Half Eagle. BD-6. Rarity-5. Small Reverse Stars. MS-63 (NGC).
- 1872 Liberty Head Eagle. MS-64 (PCGS). OGH.
The Blanchard sourced collection highlights the firm’s unmatched ability to secure the best rarities for its clients. “Since 1975, Blanchard & Co. has been the premier rare coin dealer in the country. With a specialty in legacy coins, our firm has placed more significant numismatic coins than anyone in the industry,” Zanca said.
Despite the tight numismatic market supply in 2022, Blanchard has been very successful in unearthing several private holdings. Blanchard recently placed two flagship rarities, including the 1794 Flowing Hair Dollar and the 1808 $2½ Capped Bust. Given the tiny mintages and the concentration of wealth in the United States in that era, these hallmark coins could very well have been owned by one of the American Greats of that time.
“We continue to have incredible reach within the numismatic community and can almost always find whatever you are looking for even in the current extremely tight market conditions,” Zanca said.
About Blanchard
Founded in 1975, Blanchard is the largest and most respected investment firm in the U.S. that specializes in precious metals and rare coins. Headquartered in New Orleans, Blanchard has owned and sold more than half of the published 100 Greatest U.S. Coins with over $1.3 billion in sales in the last four years alone. With over 520,000 customers to date, Blanchard has provided investors and collectors with the expert consultation they need to strategically acquire American numismatic rarities and gold, silver, platinum and palladium bullion.
David Zanca is a 28-year veteran of the precious metals industry and senior portfolio manager at Blanchard. He can be reached at 1-800-880-4653.
MEDIA CONTACT:
Sarah Munson
1-800-880-4653
Want to read more? Subscribe to the Blanchard Newsletter and get our tales from the vault, our favorite stories from around the world and the latest tangible assets news delivered to your inbox weekly.
Why a Movie Theatre Chain Bought a Gold and Silver Mine
Posted on — Leave a commentIn mid-March, the movie theater chain AMC announced their agreement to buy a stake in Hycroft Mining Holding Corp.

AMC will spend $27.9 million for a 22% stake. The investment offers much-needed support for the mining operation which is struggling financially. Hycroft owns a mine in Northern Nevada and is aiming to raise cash by selling shares. Their goal is to generate $500 million.
In recent months, AMC has seen a dramatic improvement in their financial standing as a result of their meme stock status. The stock surged more than 1,000% in 2021 giving the beleaguered chain a boost. This windfall has allowed the company to become more aggressive in their investments.
The question is: why buy shares in a mining company?
While there doesn’t seem to be any definitive answer there are some theories. Some suggest that the investment is a way for AMC to diversify their business. This move may be in response to the continued popularity of streaming entertainment. Additionally, the occasional resurgence of COVID variants has repeatedly kept audiences away from theaters.
Another reason for the deal might be the relationship between Jason Mudrick and AMC CEO Adam Aron. Mudrick – who brought Hycroft public in 2020 – was instrumental in helping AMC escape bankruptcy in 2021 by advising them to initiate an at-the-market share offering. The move helped AMC fully capitalize on their rocketing share price.
The money Hycroft raised from AMC and the money they hope to raise from others might be used to purchase new technology that can more effectively process their reserves. The viability of this plan remains to be seen.
Aron believes that the deal is a wise move for AMC because Hycroft holds “rock-solid assets” and simply needs to overcome liquidity problems to reach profitability. Aron has also indicated that he believes the deal might encourage more investors to purchase Hycroft shares.
Newly raised capital could be the shot in the arm Hycroft needs to realize the full value of their operation. The mining company is focused on gold and silver deposits in Northern Nevada. Their long-term plan is to grow into a large-scale mining operation by redesigning their process for sulfide gold and silver resources.
Immediately following the announcement of the AMC deal investors appeared enthusiastic. Hycroft shares closed approximately 9% higher after the deal was made public.
The rise might also signal a renewed interest among investors in precious metals. As geopolitical tensions continue to rise amid the Ukraine-Russia war more investors are considering of assets that might be more likely to hold their value as global markets waiver. For these investors, purchasing physical gold likely makes the most sense. However, investor appetite for gold and silver has surged enough to reignite interest in mines as well. AMC and Hycroft appear well positioned to benefit from investors’ search for stability in uncertain times.
Want to read more? Subscribe to the Blanchard Newsletter and get our tales from the vault, our favorite stories from around the world and the latest tangible assets news delivered to your inbox weekly.
Look What Happened When the Fed Threw Out Its Play Book
Posted on — Leave a commentPrior to the 2008 Global Financial Crisis, the Federal Reserve board relied upon a little known but useful guideline that economists called “The Taylor Rule.”
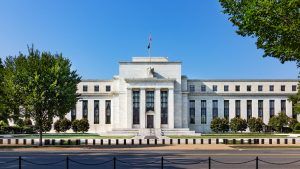
We thought it was time to dust off the Taylor Rule, shine some light on what it says – and also discuss what’s happened since the Fed abandoned its previously useful guideline.
First, what is the Taylor Rule? Stanford University professor John Taylor introduced this formula in 1993 which prescribes a certain level of Federal Reserve interest rate based on the rate of inflation and how strong the economy is growing. This mathematical formula delivers an exact level of where the Fed’s benchmark interest rate should be.
As you may be aware, the Fed’s benchmark interest rate remains extremely low by historical standards. Yes, the Fed did notch up its rate by a quarter point recently – but it still stands at a paltry 0.25-0.50%.
The fact that the Federal Reserve has stood idly by over the past six months while inflation crept higher and higher – to a now 40-year high – probably has former Fed Chairman Paul Volcker turning over in his grave.
Mr. Volcker was widely known for his success as Fed Chairman waging a successful war to end the high levels of inflation seen in the U.S. during the late 1970’s and early 1980’s.
So, where does the Taylor Rule say the Fed’s benchmark interest rate should be now?
The Fed’s interest rate should be over 5.0%, not below 1%! It’s like the Fed has been asleep at the wheel.
Not only that, in the past 14 years since U.S. central bankers threw out their playbook, the size of the U.S. balance sheet has exploded to a record high now standing at $8.9 trillion – with a “t” U.S. dollars. Before the 2008 crisis, the Fed’s balance sheet was around $870 billion. It’s no wonder inflation has skyrocketed. The U.S. government has been printing money like no time before in history and the Fed has been sitting on its hands when it comes to interest rates.
Precious Metals: A Safe Haven in These Unpredictable Times
When you can’t count on the Fed to follow predictable rules, individual investors must take the financial future into their own hands.
Precious metals have climbed in value this year as investors big and small turn to gold and silver to protect and hedge their wealth. The inflation genie has been let out of the bottle. The Fed knew better, but they still failed to act faster. When it comes to your money and your financial future, it’s never been more important to make decisions that will protect your hard earned money. Do you own enough gold?
Want to read more? Subscribe to the Blanchard Newsletter and get our tales from the vault, our favorite stories from around the world and the latest tangible assets news delivered to your inbox weekly.
What is the “S.3771 – Stop Russian GOLD Act of 2022”?
Posted on — Leave a commentIn early March a U.S. bill was introduced in an attempt to restrict Russia from selling their gold. The bill was a collaborative effort from a bipartisan group of senators.
The bill has far-reaching implications because Russia is facing the toughest sanctions ever imposed in history. Many believe the Russian government will need to liquidate their gold reserves to remain afloat economically.
Four senators introduced the Stop Russian GOLD Act. They are, Angus King (I-Maine), John Cornyn (R-Texas), Bill Hagerty (R-Tenn.), and Maggie Hassan (D-N.H). The bill takes aim at the roughly $132 billion held in gold by Russia. The goal is to dramatically limit the number of people able to buy gold from Russia. Specifically, the bill seeks to apply secondary sanctions to any American entities that deliberately engage in any transactions with Russia’s central bank holdings or anyone attempting to transport gold out of Russia. These rules would apply to both physical and digital sales of gold.
The move would further restrict Russia from participating in the global economy. The bill would also derail a critical part of Russia’s strategy which has been long in the making. In 2014, the U.S. imposed sanctions on Russia in retaliation for their invasion of Crimea. In response, Russia increased their gold purchases. This move was likely intended to safeguard the country from the impact of those sanctions and other anticipated sanctions.
In a statement, Senator King remarked, “Russia’s massive gold supply is one of the few remaining assets that Putin can use to keep his country’s economy from falling even further.” He continued, “by sanctioning these reserves, we can further isolate Russia from the world’s economy and increase the difficulty of Putin’s increasingly-costly military campaign.”
The bill, titled, “S.3771 – Stop Russian GOLD Act of 2022” would remove one of Putin’s few remaining resources. The bill not only limits Russia’s ability to survive sanctions. The bill will also makes it difficult for Putin to maintain an occupation of Ukraine even if he is successful in taking the country.
Meanwhile, costs continue to mount as Russia continues their military offensive. A study from the Centre for Economic Recovery, CIVTTA and EasyBusiness concluded that the daily cost of the war for Russia is approximately $20 billion. An inability to liquidate their gold reserves will make meeting this cost difficult.
These moves have renewed interest in gold among investors who increasingly see the metal as a reliable store of value during global turmoil. In the last six months gold, has appreciated in value by approximately 8.7% while the S&P 500 has only grown by approximately 2.1% over the same period. Moreover, the S&P 500 is down more than 6% year-to-date.
As the war continues to devastate Ukraine, it is clear that gold will become an increasingly important part of the global financial system as other asset classes waiver amid uncertainty.
Want to read more? Subscribe to the Blanchard Newsletter and get our tales from the vault, our favorite stories from around the world and the latest tangible assets news delivered to your inbox weekly.
“Pikes Peak or Bust!” This Coin Captures Heart of Colorado’s Rich Gold Rush History
Posted on — Leave a commentAfter the panic of 1857, many Americans eyed the West as an opportunity to achieve financial security. In 1858, the Colorado Gold Rush began with over 100,000 people  flocking to the Rocky Mountain region.
“Pikes Peak or Bust” was a common refrain among the early prospectors, in reference to the imposing mountain in the Colorado Front Range.
In the early days of the Colorado Gold Rush, money was scarce. The prospectors paid merchants for goods they needed with a pinch of gold dust from their pouch. The “pinch” was intended to equal $1 of gold and weigh 0.05 troy ounce. However, merchants with fat fingers captured bigger pinches of gold and prospectors were left with smaller wealth.
The need for standardization of money was clear – and this opened the door for the creation of private or “territorial” gold. Enterprising businessmen partnered to open private mints that turned the gold dust into usable and standard-sized gold coins.
These early private minters assayed and refined the gold dust, cast and rolled it to a certain thickness then cut the gold into round blanks. And, then machine-pressed them into gold coins for their customers.
Clark, Gruber & Co. was the first and most well-respected mint in Colorado during this time period. During the firm’s first three years of existence, they minted a reported $594,305 worth of Pikes Peak gold.
Eventually, the United States Mint acquired Clark, Gruber & Co. and it became the Denver Mint.
Clark, Gruber & Co. minted $2 1/2, $5, $10 and $20 gold coins.
The 1860 version of the $10 gold coin featured an amateurish representation of Pikes Peak. The 1861 coin was upgraded to appear similar to the Liberty Head federal gold coins in existence at that time, with the addition of PIKES PEAK on her coronet.
Want to read more? Subscribe to the Blanchard Newsletter and get our tales from the vault, our favorite stories from around the world and the latest tangible assets news delivered to your inbox weekly.
The Enduring Appeal of the 1862-S Seated Liberty Dime
Posted on — 2 CommentsThe Seated Liberty images were one of the most enduring in the history of US coinage. This design appeared on the half dime, dime, quarter, and half dollar between 1836 and 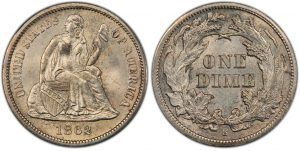 1891. The Seated Liberty image also appeared on the silver dollar from 1836 to 1873.
The design was the work of Mint engraver Christian Gobrecht. He served as the third Chief Engraver from 1840 to 1844. His engraving work started before he was employed by the Mint. Originally, he engraved ornamental clocks. He was a pioneer in his field and invented a medal ruling machine which reproduces relief on smooth surfaces in 1810. He also improved upon the camera lucida, the pump organ, and even a talking doll.
Gobrecht’s first attempt to become chief engraver of the Mint was unsuccessful. He wrote to President James Monroe requesting the position but was denied. Eventually he was appointed “Second Engraver” in September of 1835 after the Chief Engraver, William Kneass suffered a stroke. Five years later Kneass passed away and Gobrecht was appointed Chief Engraver.
His Seated Liberty designs for which he is remembered were based on sketches by portrait painter Thomas Sully and ornithologist Titian Peale.
The obverse of the 1862-S Seated Liberty half dimes and dimes show the figure of Liberty in a flowing dress seated upon a rock. In one hand she is grasping a Liberty pole with a Phrygian cap perched on top. The cap has long been a powerful symbol of freedom and traces back to the Neoclassicism movement. The cap also represents the pursuit of liberty.
The figure has her right hand on top of a striped shield inscribed with the word “Liberty.” This feature of the design is meant to represent America’s willingness to fight for freedom. Above her is an arc of thirteen stars to represent the thirteen original colonies.
The reverse side shows the denomination, in this case reading “Half Dime.” Both the 1862 Seated Liberty half dime and dime pieces feature a wreath surrounding the denomination words. All coins that predate 1860 include the image of laurel leaves which, like the Phrygian cap, are a Neoclassicism inspired image. By the start of 1860 the design was altered to include agricultural products including wheat and corn.
Originally, the Seated Liberty dimes and half dimes contained no stars. This design element was added in 1839.
The Seated Liberty imagery was standard on US coins ranging from half dimes to half dollars until 1879 when the Bland-Allison act significantly reduced the minting of the coins. In time, tastes changed and there was growing support for a new design. Eventually, the Barber Head design replaced the Seated Liberty.
Today, this design remains one of the most powerful images on US coins. It blends an array of images that represent freedom, patriotism, and liberty.
Gobrecht died in July of 1844 but his contribution to US coinage lived on in the Seated Liberty design.
Want to read more? Subscribe to the Blanchard Newsletter and get our tales from the vault, our favorite stories from around the world and the latest tangible assets news delivered to your inbox weekly.
How Investors Compare Gold and Silver Investments
Posted on — Leave a commentThe precious metals sector is roaring higher in 2022 fueled by the Russian war in Ukraine, skyrocketing crude oil prices, a sinking stock market and inflation at 40-year highs.

As investors turn to precious metals as a portfolio risk diversifier, store of value over the long-term and a hedge against crisis – you may wonder – what’s the difference between investing in gold and silver? Before we highlight three differences, let’s take a look at the performance numbers. The precious metals sector has rocketed higher in the first quarter, while the equity market has fallen into a correction phase.
2022 Year-to-date performance
Winners
Palladium +53%
Platinum +15%
Silver +12%
Gold +9%
Losers
NASDAQ -16%
S&P 500 -11%
Dow -9%
Data as of March 9, 2022
Gold and silver are both rewarding investors with solid returns this year, with a modest silver out-performance. While gold and silver often trade in parallel, there are differences to consider.
Liquidity and Size
The gold market is one of the most deep and liquid markets in the world and is bigger than silver. This simply means it is easy to buy and sell gold at any moment in time. In 2019, the value of the global gold market was pegged at $24.5 trillion, bigger than the $4.4 trillion silver market, according to consulting firm CPM Group. The large size of the gold market means that major players can move large positions (buying and selling), without moving the price. For anyone trading smaller positions (and this applies to most individual investors), the liquidity isn’t an issue for either gold or silver. But, gold does take the edge in this category overall.
Volatility
In general, silver is considered to be a more volatile metal than gold. This simply means it can move faster than gold, which we’ve seen already in 2022 with silver’s out-performance. Volatility can be a double-edged sword – for short-term investors looking for quick gains – it can offer faster price appreciation. But, on the flip side, it could also erase those gains more quickly too.
Diversification
Both gold and silver bullion offer investors diversification properties – especially as they are both “hard” assets, versus “paper” assets like stocks, bonds or ETFs. However, gold again has the slight edge here over silver, as the latter is more connected to the business cycle. In addition to its value as a monetary metal, silver is widely used in manufacturing, electronic and construction. When industrial demand slows as economic growth weakens, that can tamp down demand for silver.
Meanwhile, gold is a long proven investment portfolio risk diversifier, in large part because gold has nearly zero correlation to movement in the stock market, according to a 2015 Journal of Managerial Finance research paper.
How to Measure Value
The gold/silver ratio is a time-honored method for investors to measure the relative value of these two precious metals. The ratio simply reveals the number of silver ounces needed to buy one ounce of gold. A high ratio is generally viewed as a signal that silver is undervalued relative to gold. That is what we’re seeing now.
Current Ratio: 76 oz. silver = 1 oz. gold
Historically, readings above 65 signal that silver is undervalued and is a strong buy signal for the metal. Silver continues to offer a great value to investors.
The Bottom Line
Gold recently scaled the $2,000 level, touching a new all-time high at $2,051 an ounce. Silver trades above $26 an ounce. Both precious metals are in a strong bull market cycle and offer opportunity for investors to protect and preserve their wealth. If you are exploring adding more protection to your portfolio, consider acting now before prices move even higher.
Want to read more? Subscribe to the Blanchard Newsletter and get our tales from the vault, our favorite stories from around the world and the latest tangible assets news delivered to your inbox weekly.
Financial Markets in Times of War
Posted on — Leave a commentThe stakes have reached new heights. As Putin puts nuclear-deterrence forces on alert many are hoping the planned talks between Ukraine and Russia yield progress.

In an effort to hamper Putin’s invasion, the U.S. and many European countries have imposed sanctions against Russia. Recent moves directed at Russia’s central bank will dramatically limit the country’s ability to participate in the global financial system.
One key outcome of these measures is that the government will likely struggle to access their foreign exchange reserves. This would further diminish the value of the ruble. In this scenario Russian officials would need to find other ways to support their currency. Those options are limited.
This has left many people wondering what the international financial picture will look like in the coming days.
Reporting from the Financial Times suggests that the fallout might be confined to Russia and that “the direct exposure of western financial institutions to Russia is modest, partly due to sanctions imposed after its 2014 annexation of Crimea, as well as the rise of more investor-friendly economies in Asia.”
The authors explain that only 3.4% of MSCI’s emerging markets equity index is Russian-based. In the meantime, Russian citizens will face considerable difficulties as long lines form at ATMs and more people try to withdraw their funds from banks. This flurry of activity is likely to spur more fear leading to more withdraws. The result would be a run on banks.
While the most severe damage will be felt in Russia, many other countries will suffer to some degree from the recent move to ban Russia from the SWIFT international payments system. This decision will impact trade, given that Russia accounts for 10% of oil and natural gas production.
Other countries are likely to experience slowing growth and a continued rise in inflation. Production supply chains will suffer or in some cases come to a complete stop.
With so many influential factors in play many investors are uncertain about how to proceed through the fog of war. A look into the past might offer some answers.
Data from LPL Research shows that the Dow Jones Industrial Average fell by an average of 2% during 16 major events unfolding between 1990 and 2020.
Expanding the timeline offers even more perspective. The average total drawdown of the S&P 500 following 21 major geopolitical events since 1941 was 5%. Some of these events include things like the assassination of President John F Kennedy and the 9/11 terrorist attacks. The average amount of time the S&P 500 has needed to recover from those losses is just 45 days.
The road ahead is unclear but US investors should take a moment to remember that dramatic financial market movements are common during periods of upheaval. Fortunately, they are typically also short-lived.
Want to read more? Subscribe to the Blanchard Newsletter and get our tales from the vault, our favorite stories from around the world and the latest tangible assets news delivered to your inbox weekly.
The Allure of Peace Dollar Collections: History, Key Dates & Design
Posted on — 5 CommentsThe silver Peace Dollar, minted between 1921 and 1935, represents one of the most celebrated and lasting designs in numismatics. Its simple beauty, its connection to the peace that followed World War I and its unique status as our country’s last circulating silver dollar make it a highly sought-after coin series among collectors. While many are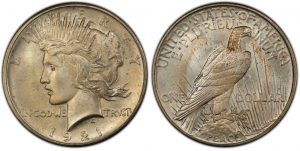 familiar with this coin, what is less widely known is how scarce Peace dollars are in high grades.
Peace Dollar History
After World War I ended, numismatic collectors advocated for a coin to celebrate and commemorate the peace after the “war to end all wars.” Farran Zerbe, President of the American Numismatic Association from 1908 to 1910, first proposed the idea of a coin that symbolized America’s role in the peace process.
Peace Dollar Design
A design competition for the new coin was announced. A 34-year old Italian sculptor named Anthony de Francisci won the honor of designing this important coin. De Francisci’s stated goal for this coin was to “capture the spirit of the country—its intellectual speed, vigor, and vitality.”
The Peace dollar obverse reveals a portrait of Miss Liberty facing left, wearing a stunning radiating crown. On top LIBERTY encircles her crown, and IN GOD WE TRUST and the date lie below. The reverse of the silver Peace Dollar features a bald eagle, resting on a rock, clutching an olive branch above the word “PEACE.” Rays of sunlight brighten the background.
De Francisci created two different designs for the coin’s reverse. The key difference? One version featured an eagle breaking a sword while the other was holding the olive branch. Initially, the design featuring the broken sword was considered. After a public outcry voiced concerns this represented defeat, the broken sword was quickly removed from the coin’s design and the more peaceful looking olive branch design was chosen.
Minting Began in 1921
The silver Peace dollar was issued under the terms of the Pittman Act. That act required the U.S. Mint to strike millions of silver dollars, which began in 1921 initially using the Morgan dollar design. Treasury Secretary Andrew Mellon approved the Peace dollar in December 1921.
While just over one million 1921 $1 High Relief Peace dollars were minted in Philadelphia, the majority met their fate in the melting pot. The high relief was deemed impractical for coinage and was quickly modified to “low relief” in 1922.
Survival estimates in all grades of the 1921 $1 High Relief Peace total 100,000 with only 5,000 in grades 65 or better.
Today, collectors are attracted to the coin not only for its scarcity in certain grades and dates, but also for the Peace Dollar’s historical significance recognizing America’s role as an international power, while also honoring the sacrifices our citizens made in first World War.
Completing a Set
There are a variety of options for Peace dollar collections including lower-cost sets to an ultra-pedigree collection. It takes 24 different combinations of dates and mint marks to complete a set.
One strategy for completing a Peace Dollar collection is to acquire the first four Philadelphia Mint issues of 1922 through 1925. These dates represent the first four years of issues for the “low relief” version of the Peace Dollar and create an outstanding set of four with consecutive dates.
The first-year 1921 is one of the scarcest Peace dollars in both circulated and mint state condition. This coin is considered a very important one-year-only silver type coin.
If you desire to collect a key date Peace Dollar, consider the 1928 Peace Dollar minted in Philadelphia, which stands as the smallest production year of this coin with only 360,649 struck.
While MS-63 coins are fairly easy to obtain, quality MS-65 and higher grades are quite rare. See an example of a certified MS-66 Peace dollar here.
There are many strategies for collecting Peace dollars. If you’d like more information on a collecting strategy that fits your budget and investing goals, contact a Blanchard portfolio manager for personalized recommendations. Your Blanchard portfolio manager can also help you source certified dates in this series.
Want to read more? Subscribe to the Blanchard Newsletter and get our tales from the vault, our favorite stories from around the world and the latest tangible assets news delivered to your inbox weekly.
Geo-Political Tensions, Inflation Trigger 2022 Gold Rush
Posted on — Leave a commentGold climbed above the $1,900 an ounce level on Monday, hitting a fresh 8-month high. Investors are chasing the gold market higher, yet analysts say it’s not too late to get into this move.
Investors have long turned to gold for protection against inflation, which has erupted to a whopping 40-year high. Yet, gold also acts as a safe-haven asset and offer stability, wealth preservation in times of geopolitical stress. As the Russian-Ukraine military tensions hit a boiling point, investors are seeking safety in gold.
Concerns that an outbreak of war between Russia and Ukraine could send risky assets like stocks tumbling lower has increased demand for gold, which is prized for its stability during times of crisis. If Russia invades Ukraine, crude oil prices are expected to move higher amid Russian supply disruptions adding to current inflation woes.
Investors have rushed firmly into gold in recent weeks buying the late January price dip at $1,792.60 an ounce. Since then? Gold jumped 6.27% higher in less than a month.
Worried you missed the move? Don’t be.
“We never like to be late to the trade, but this might be one of those times when it makes sense to chase it. The precious metal, despite the move, is still trading below its spring 2021 high of $1,909.90 and could be ready to break out,” said a Feb. 19 Barron’s article.
“Investors are looking for a geopolitical hedge,” Matt Miskin, co-chief investment strategist at John Hancock Investment Management told the Wall Street Journal on Feb. 20. “The stars are aligning in essence for a gold breakout.” If the Russian-Ukraine situation worsens, it could be the trigger to push gold to a new all-time record high, Miskin said. Gold scored its all-time high at $2,051.50 in August 2020.
A February BofA Global Research report agrees. “It’s time to buy more gold especially if it breaks 1860/1880 as new all-time highs would follow,” the report said. Gold has already pushed through $1,880 an ounce, recently trading over $1,900. The BofA Global Research report pointed to new all-time highs at $2,175 an ounce.
Gold is indeed on the move and momentum is building fast. While gold is priced and sold in U.S. dollars on the global market, analysts like to compare gold to other currencies to spotlight trends – and the trends there point higher too. Consider this: Gold hit a new all-time high last week, priced in Japanese Yen. Gold also climbed to fresh 52-week highs versus both Euro and Australian Dollar.
It’s not too late to get in on the 2022 Gold Rush, if you act soon.
Want to read more? Subscribe to the Blanchard Newsletter and get our tales from the vault, our favorite stories from around the world and the latest tangible assets news delivered to your inbox weekly.


