


What Place Does Gold Have in Today’s Market?
Posted on — Leave a commentVolatility is surging back into the equities market with a vengeance. Morgan Stanley recently reported that in the first quarter of this year the S&P 500 moved at least 1% on twenty-three different trading days compared to just eight days throughout all of 2017. Increasing interest rates, fears of a trade war, and an undercurrent of geopolitical concerns are all driving this activity. Lately, gold bullion investors are asking “what’s my place in these turbulent markets?” The answer can be found with a look at history.

CFA Russ Koesterich, writing for BlackRock explains that “historically gold has outperformed equities by an even larger magnitude when volatility is rising from an already elevated level.” The research illustrates a compelling picture for bullion investors. Russ continues, “From 1994 to the present using Bloomberg data, during months when the VIX was already above 20 and rose even further, gold outperformed by an average of nearly 5%, beating the S&P 500 roughly 75% of the time.” These findings make intuitive sense; as volatility rises, so do investors’ trepidations about the future. These concerns, in turn, lead those same investors to seek “haven” assets, namely precious metals.
These concerns, however, are not spurred by volatility stemming from politics and shifting trade dynamics alone. Interest rates have always played a significant role. For example, consider that there were eight years between 1974 and 2008 in which U.S. inflation was more than 5%. In these periods, gold increased in value by 14.9% in real times. As a result, gold outperformed stocks, bonds, and other commodities.
Even over a more recent time horizon of March 1997 to May 2009, gold outperformed several other haven investments. Gold generated an annualized real return of 5.9% while the S&P Commodities Index (GSPI), real estate investment trusts (REITs), and US Treasury Inflation-Protected Securities Index (TIPS) each yielded a lesser annualized real return of -0.2%, -3.8%, and 3.7% respectively. Moreover, volatility was higher for all these other asset classes during the period excluding TIPS.
What do these numbers mean for today’s investor? They illustrate the value of gold as a portfolio hedge not only in times of rising rates or even in times characterized by fears of rising rates. These findings remind us that gold has a place in an investor’s portfolio even when rates are low and expected to remain low.
However, the current economic climate portends a different scenario; rates are on the rise and will continue to climb making gold an even more attractive investment.
These rising rates are just another step in the Fed’s long journey from their days of substantial quantitative easing which echoes the tumultuous years of the great recession. In such an environment gold continues to be an effective diversifier without the volatility which incites anxiety.
Too often we think of an investment in gold as a replacement for equities. Many investors shy away from the asset fearing the opportunity cost associated with equities rise especially over the last several years. In truth, gold offers not only a respectable return; it offers protective features other assets cannot. With more rate increases on the horizon, the time to act is now.
Inside Scoop: Gold Traders Are Buzzing About This One Number
Posted on — Leave a commentIn the gold community, there’s a lot of buzz about one number right now.
Curious?
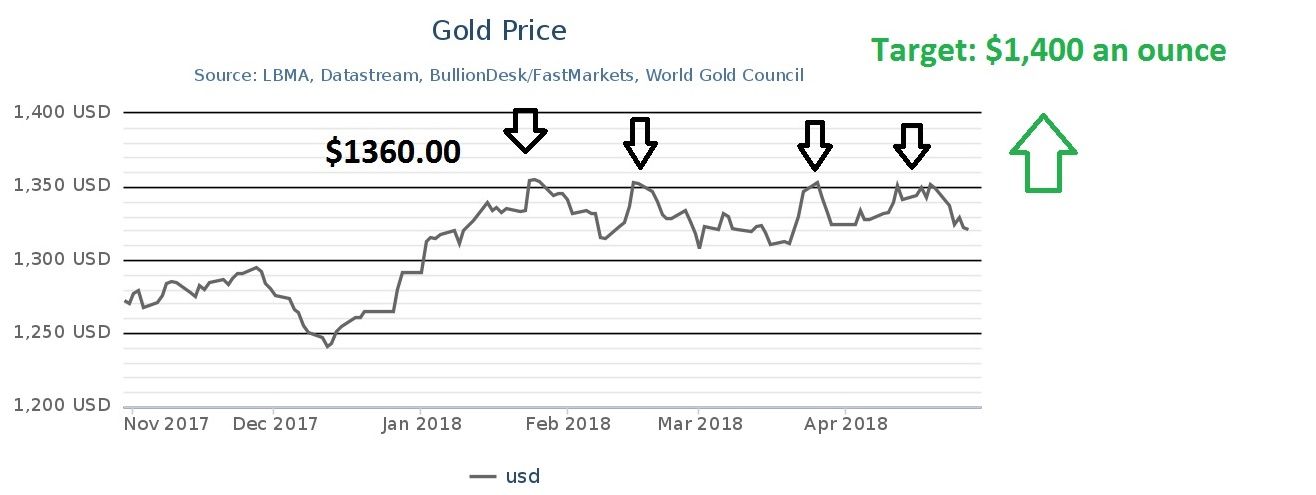
That number is $1,360 an ounce. A key price that gold bulls have tested several times in the past three months.
You’ve heard the expression: Knocking on the Door of Big Opportunity? That’s what gold is doing right now.
Don’t take our word for it, listen to what Jeffrey Gundlach, CEO at DoubleLine Capital said about the gold market last week.
“Something big is happening,” Gundlach, who oversees more than $119 billion in assets, said about gold to Reuters.
He pointed to the technical charts of gold, which plot the daily prices and said that “explosive potential energy” of a huge base was signaling a $1,000 move in gold.
Take a look at Figure 1 below, which shows daily price action in gold. Several times in 2018, the gold market has been knocking on the door of a key price ceiling $1,360 an ounce.
Coiling: Just Like a Spring
Technical traders like to use a term called “coiling.” Think of how a spring is all coiled up, but then explodes higher. That’s what gold is doing right now.
Gold is coiling in a narrow and well-defined price range between $1,360 and $1,310. A bullish breakout above $1,360 will trigger a massive buy signal and gold, with the first stop at $1,400 an ounce. The rally will likely be fast and furious as day traders and momentum traders pile into the market at this key level.
You’ve Heard The Advice Before: Buy Low
The price of gold is near the bottom of the range right now. That offers investors an excellent buying opportunity before the price rebounds to the top of the range.
One of these weeks, there will be a trigger, and gold will smash through that $1,360 ceiling and soar fast toward the $1,400 level.
Would you like to be able to say you bought at the low? Act now and you’ll get bragging rights along with a nice big profit on a bullish gold market breakout.
Read More:
Look Who Thinks Gold Prices Will Rise
Could Gold Hit $10,000 An Ounce? Jim Rickards Says Yes
If you enjoyed this article, please share it with a friend.
Start the conversation. Have a question or comment? Leave it below.
A Blanchard expert is happy to help guide you through the purchase process and help you select an investment appropriate for you risk tolerance and long-term financial goals. Call a Blanchard portfolio manager today at 1-800-880-4653.
This Week in Gold: Blockchain, Big Change and Insane
Posted on — Leave a commentBlock chain
Investors continue to contrast the merits of investing in gold versus bitcoin. Most fall on one side of the debate and argue that one is better than the other. However, a recent development in the world of blockchain – the technology underpinning bitcoin – has unexpectedly joined these two assets.
Leaders in the gold and diamond market have teamed with IBM to harness the capabilities of blockchain. They intend to use the technology to track the provenance of the gold and diamonds in jewelry. IBM is powering the initiative, called TrustChain. This plan is a response to concerns of illegal and unethical practices surrounding gold and diamond mining in some regions. IBM’s Senior vice president remarked, “Consumers care deeply about the quality and source of the jewelry they purchase.” This concern is evidenced by the fact that “66 percent of consumers globally are willing to spend more to support sustainable brands,” she continued. This research comes from a Nielsen study which also found that “personal values are more important than personal benefits, such as cost or convenience.” Blockchain technology suits this task because it provides transparency via an open source ledger which updates in real time. It looks like gold and bitcoin are not so different after all.
Big Change
Sometimes gold just doesn’t know how to behave. Historically, gold and U.S. interest rates have been negatively correlated. In fact, this negative correlation increased sharply between 2013 and 2017. However, as of late, something has changed. As the World Gold Council remarks, “Gold continues to trend higher – increasing by 8.5% since the Federal Reserve rate hike in December 2017 – despite interest rates rising at an accelerated pace.” What’s going on here? Shouldn’t gold returns increase during periods of falling rate and vice versa? After all, investing in gold in such an environment wouldn’t come at the cost of foregoing U.S. Treasuries. However, the factors influencing gold prices are more numerous than just U.S. rates. Even in a rising rate environment, gold returns can increase as global demand for jewelry and technology increase. In fact, as the World Gold Council explains, the primary factors driving gold prices are, economic expansion, market uncertainty, opportunity cost of competing assets, and capital flows. This week Barron’s concluded that “Gold’s outlook looks rosy. The precious metal should benefit from late-cycle dynamics, which tend to favor real assets over stocks.”
Insane
Recently, the Managing Director of Sofies, a sustainability consulting and project management firm, remarked that just one ton of discarded cell phones contains as much gold as an entire mine. He continued to explain that “Gold is present in nature, and, on average, the concentration of gold is about 0.5 grams of gold for every one ton of material.” However, he continues, “in one ton of mobile phones, there is usually about 350 grams of gold.” The difference, and the opportunity, speaks for itself. Precious metals, like gold, can be reused in perpetuity, whereas other recyclables, like plastic, can only be reused a few times before their base properties breakdown. As the number of tech products in the American home increases, the stockpile of unused gold, copper, and iron and other metals also grows.
What the “Hubbert Peak” Theory Tells Us About the Gold Beneath Our Feet
Posted on — Leave a commentThough no one is certain, experts agree that humans have mined approximately 190,000 tons of gold from the Earth. Nearly half (48%) of this has been manufactured into jewelry. Nearly a quarter (21%) has been funneled into private investments. This leaves 17% in the private sector and the remaining 14% allocated towards “other” sectors like technology. These numbers leave one question unanswered, how much gold is left under our feet?
Amazingly, two-thirds of our above ground gold was mined after 1950. In the great span of time, theses last 68 years are just a blink. This short period might lead one to think that over the next 100, or even 200 years we can look forward to hundreds of thousands of tons. The truth, however, is much different.
Experts believe current, below-ground reserves total just 50,000 tons. This relatively modest figure is in contrast to rising gold production in recent years. In fact, gold extraction has a history of successive peaks. In 1912, 1940, 1971, and 2001 gold production peaked with each year outpacing the previous one. This pattern resumed in 2011 and production reached new highs for every one of the following years through 2015 when production hit 3,100 tons. In recent years production has flattened out at about this level.
These figures have led to differing estimates regarding “peak production,” the period during which global gold extraction maximizes and is followed by a period of decline until there is no more extractible gold. This terminal decline underpins what is called the “Hubbert peak” theory.
The theory comes from American geophysicist M. King Hubbert. In 1956 he presented the American Petroleum Institute a paper outlining his theory. In the case of Hubbert, the idea of peak production was applied to petroleum. He predicted that global extraction would reach its peak between 1965 and 1970. He was right, but he was also wrong.
Oil production did, in fact peak in 1970. However, this pinnacle has not been followed by a sustained, decline wherein each year yields less than the previous one. The reason: new technology has equipped us with the tools to pull oil from unconventional resources. Will gold mining follow this story?
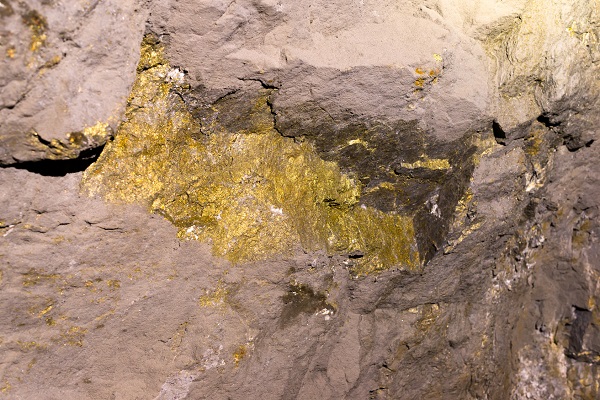
The answer is complex; gold extraction is connected to more than technology. Mining operations are inextricably linked to gold prices; if gold becomes too cheap they turn off the machines. They may be able to pull more gold from the Earth, but if those finds cannot be sold at a price that exceeds the operational costs, then it’s not worth the effort. In fact, when miners consider new deposits they segment them into “reserves” and “resources.”
A reserve represents gold that’s economic to mine at current gold prices. Resources, however, are finds that offer the potential to be profitable in the event that gold prices rise. Moreover, while technology may be increasing our capabilities, researchers are discovering that deposits are becoming increasingly difficult to access than in previous decades. Consider that “The likelihood of a discovery leading to a mine being developed is very low – less than 0.1% of prospected sites will lead to a productive mine,” according to research from The World Gold Council. Meanwhile, “10% of global gold deposits contain sufficient gold to justify further development,” they continue. Exploration alone can take up to 10 years and involve heavy costs like geological surveys and chemistry analysis.
The time to get your gold is now.
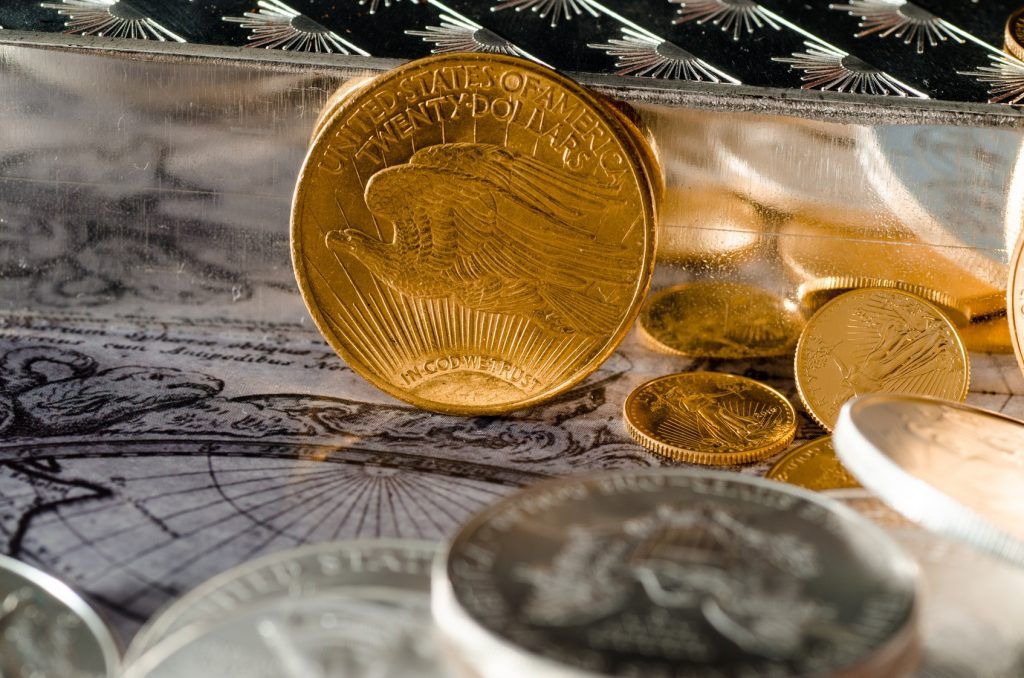
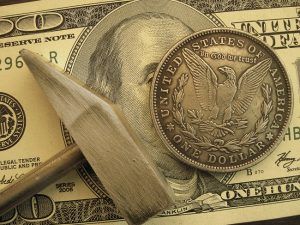
What Drives The Price Of Gold Coins?
Posted on — Leave a commentHave you ever wondered what makes the price of gold coins rise and fall? Check out our top 5 list here.
Factor 1: Price of Spot Gold
A key factor that drives the price of gold coins higher and lower is the value of spot gold (the open market price for gold bullion that fluctuates every day.) As gold prices climb, gold coins tend to climb – sometimes even more dramatically than spot gold.
There is typically a “spread” or a difference between the price of a gold coin and spot gold. The spread reflects the additional value of a coin, based on its rarity and condition.
The long-term trend for gold is up. You could buy a 1-ounce gold coin for around $255 in 2001. Now, 17 years later, that same 1-ounce gold coins sells for around $1,350.00 an ounce. Rare coin prices are trending higher too. See spot gold prices here.
Factor 2: War, Military Conflicts, Political and Economic Uncertainty
Gold is a “safe-haven” asset, and it has been for centuries. Kings, governments, the wealthy and mom and pop investors have turned to gold for hundreds of years as a method to preserve and grow wealth. It is a universally accepted store of wealth.
In 1980 – as gold soared to its then all-time high at above $800.00 an ounce, geopolitical conflicts like the Soviet invasion of Afghanistan and revolution in Iran supported the big price gains. That supports the price of rare coins too.
Today, the world feels even more unstable. The threat of trade wars loom over economic growth. Russia has been accused of meddling in democratic elections. The United States bombed Syria earlier this month. The isolated dictator of nuclear-armed North Korea continues to posture for more control on the world stage.
An escalation of any of these events has the potential to send gold and rare coin prices soaring higher in 2018.
Factor 3: Inflation
Gold has long-been considered an excellent hedge against inflation, which is of course, rising prices. Inflation typically climbs 3%, on average, every single year. Add that up over a 20-year period, and your hamburger, gallon of gas, trip to the doctor or new car just got a lot more expensive.
A 35-year study by Penn State University researchers found that when inflation turns up, the response of coin prices could well be quicker and larger than the returns on most other assets – even gold bullion. That means the price of rare coins rises faster than even spot gold during periods of rising inflation.
Factor 4: The U.S. Dollar
The U.S. dollar and the price of gold (and gold coins) have a negative correlation. That simply means, as the dollar goes down in value, the price of gold goes up. Blanchard CEO David Beahm recently wrote about this in his weekly LinkedIn commentary. Since 2001, the value of the U.S. dollar fell by 27%. That means your same hard-earned dollar is now worth 73 cents.
Factor 5: The Stock Market
A key factor that makes rare coins and gold bullion a great investment is its low correlation to the stock market. When stock prices fall in a bear market or a panic, gold prices tend to rise – and history has shown rare coins climb significantly during this time. Portfolios that contain at least some gold or rare coins outperform those that don’t.
This was evident during the 2009 bear market in stocks. The Saint-Gaudens “Double Eagle” climbed significantly more than the price of spot gold.
Gaudens are one of the rare coins that most often mimic the movements of gold bullion. When gold is trading up, Saints trade up, and vice versa. But once gold starts a significant run higher, Saints can significantly outperform gold prices at the same time.
The Bottom Line
Gold coins often track the price of spot gold. However, there are many instances when rare coins significantly outpace the underlying price gold.
Read More:
People Find Millions of Gold in Attic, Backyard
Posted on — Leave a commentDo you know what’s in your attic or under your floorboards? If you live in an older house, it’s worth checking.

After the bank runs and failures during the Great Depression ended, many Americans maintained a deep distrust of banks. Instead of depositing their savings into a bank, they hid it at home.
Common hiding places for gold coins:
- Above false closet ceilings
- Beyond loose bricks around fireplaces
- Underneath carpet
- Inside chair and couch cushions
- Under floorboards
- Inside pianos
You never know when you are going to accidentally find a fortune.
3 True Stories
- In 2016, a man in France found $3.7 million worth of gold in a house he inherited from a deceased relative. The man – who had no idea he was about to become a millionaire – started moving furniture around and found a box of coins attached to one piece. He continued searching and found gold inside an old whisky box, in the bathroom and under piles of linen. In total, he found 5,000 gold pieces, two gold bars and 37 gold ingots, weighing more than 200 pounds.
- In 2015, a Florida family found 18th century Spanish and Portuguese coins in their Grandpa’s attic. It’s believed the coins belonged to infamous Tampa Bay pirate Jose Gaspar.
- In 2013, a California couple found 1,427 rare mint-condition gold coins buried in their backyard. Estimated value? 10 million dollars.
Death is perhaps one of the biggest reasons these hoards get lost. People forget where they hide them or fail to tell their heirs where to look. The excitement and instant wealth these lucky people stumbled upon shows the ever-lasting value of owning gold coins and rare numismatics. If you are looking to build your own personal wealth and didn’t find anything in your attic, start building or adding to your coin portfolio now.
Rare Coin Index Hits New All-Time High In 2018
Attention: Rare coin collectors! The price trend is up.
Rare coin values have been on a tear in recent months hitting a new all-time high in February 2018.
In fact, rare coin values increased for five consecutive months from November 2017 into March 2018. In April, the rare coin values retreated ever so slightly. That’s to be expected. Nothing goes straight up forever.
The US Coin Values Advisor’s Rare Coin Values Index “tracks the price movements of 87 key date United States rare coins, then combines their overall performance to arrive at a composite score, in an effort to gauge the direction and strength of the U.S. rare coin market. The Index uses January 2000 as its baseline (i.e. the Index score that first month was 100.00). Regular issue coins from the Half Cent to $20 Double Eagle are represented in the Index.”
As coin values retreated slightly in April – this represents a good time to make new purchases. No need to chase prices. Use the current pullback as a buying opportunity.
What is on your rare coin wish list? It’s time to go shopping.
The Strange Tale of The Borneo Gold Hoax
Posted on — Leave a commentCan a man turn his gold wedding ring into a company with a $6 billion valuation? History tells us the answer is yes. This is the story of a Borneo gold mine and a man with a dream that became a nightmare. It’s the story of Michael de Guzman.
Canadian geologist John Felderho gained recognition after helping to discover a substantial gold and copper mine in Papua New Guinea. It was a once-in-a-career find. Then, suddenly, it seemed fate would put another buried treasure within reach. Filipino mining prospector Michael de Guzman brought some gold core samples to Felderho in 1994. The samples came from the Borneo jungle, and the traces of gold within became the basis of an estimate that 136,000 pounds of gold could be below the surface. Moreover, the land was for the taking, other, larger mining companies that previously explored the same area found nothing and decided to move on. Based on Felderho analysis of the samples Canadian penny-stock mining company Bre-X quickly bought the land. More good news followed.
The estimated gold deposit rose to 2 million pounds in 1995, then to 5 million pounds. Soon Bre-X investors started taking note. The stock, once valued at just 30 cents a share started to climb. Felderho conferred with analysts at J.P. Morgan all of whom were eager to get in on the historic find. By 1997 the stock ascended to $250 per share. Fortunes were made overnight. The company’s inflation adjusted valuation reached $6 billion. The problem, however, was that this “was one of the great frauds perpetrated in North America” according to a lawyer who later represented investors.
Michael de Guzman’s gold was “salted.” That is, he dressed up the samples to appear indicative of gold. In reality, the gold within was nothing more than shavings from his gold wedding band. As the scale of the deceit grew, he added more gold to the samples, this time from a small nearby panning operation.
The lies came to light when Indonesian President Suharto entered the picture. With the find occurring in his domain he became intensely interested in making his claim. He also insisted that another, more established, mining company join the operation. After all, with millions of pounds of gold below the dirt, they would need a few more shovels. It wasn’t long before the other mining company, Freeport-McMoRan Copper & Gold, insisted on reviewing and analyzing the Borneo gold samples for themselves. Soon after, they discovered de Guzman’s ruse.
In the following months, de Guzman’s disappeared in the jungle. Later, people discovered a molar in the dirt; it was de Guzman’s. Investigators believe he jumped to his death from a helicopter while en route to a meeting with Freeport. $6 billion in value vaporized almost immediately. Investors were left with nothing, not even dirt.
In 2014 an Ontario Superior Court justice decided to discontinue the languishing lawsuits against Bre-X. The decision was not an indication of innocents; it was instead an acknowledgment of insolvency; there was no money remaining to repay investors. Years earlier, in 2007, Felderho was acquitted of all charges. In the end, the only ones to make any money were the lawyers.
Attention Coin Collectors: Can You Answer These 4 Questions?
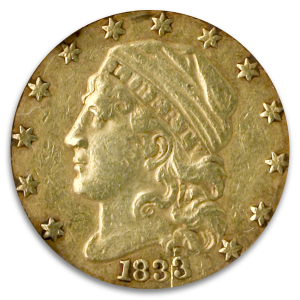
Posted on — 2 CommentsInvesting in rare coins is not only fulfilling financially, it’s fun too. Owning a rare coin is the opportunity to walk back in history. Learn more about the era in which the coin was circulated and the rich heritage of the coin itself. Here are four questions. Let us know if you already knew the answers.
1. Question: What is the most expensive coin sold?
Answer: The Flowing Hair Silver Dollar.
Minted in 1794, sold for a record price of $10,016,875 in January 2013.
A little history: These are the first dollar coins to be issued by the U.S. government and were were minted for only two years: 1794 and 1795. Only 1,758 of these dollar coins were produced in the first year, and those were intended for use as souvenirs rather than legal tender.
Although the first specimens produced were deemed at the time to be of poor quality, these dollar coins have become among the most highly prized collectibles with numismatists and investors.
2. Question: What is one of the most valuable coins you could find in your pocket change?
Answer: 1969-S Lincoln Cent with a Doubled Die Obverse
This extremely sought after and rare coin is easily identified by extremely strong doubling on the motto IN GOD WE TRUST as well as on the word LIBERTY and the date on the obverse (heads side).
After the collecting community noticed the aberration, early coins were reportedly seized by the Secret Service amid concerns of counterfeiting. However, once the coin was confirmed to be genuine, collectors began searching in earnest for this coin and the hunt continues today.
Last Year: A Michigan coin collector was searching through a 50-coin roll of pennies and stumbled upon an uncirculated 1969 – S Double Die Lincoln penny, a 2017 report noted. The coin was estimated to have value of at least $44,000 and perhaps as high as $100,000.
3. Question: What is the average lifespan of a dollar bill?
Answer: A $1 bill lasts about 22 months before it is so worn that is must be taken out of circulation and replaced, according to the Federal Reserve. A $5 bill lasts slightly longer at two years and a $10 bill lasts three years. A hundred? That lasts about nine years.
Nonetheless, “paper” money can’t hold a candle to gold and silver coins. Want to compare that to a lifespan of a gold coin? One of the world’s oldest gold coins – an Ionian “Striated” Stater, was sold to a private collector in 2016. The coin is estimated to be 2,650 years old.
4. Question: Why do some coins (like quarters and dimes) have ridges?
Answer: When common circulated coins were made of gold and silver, some enterprising thieves would shave off the edges of these coins and sell them.
The U.S. Mint fought back against this illegal practice by adding ridges or “reeds” on the sides of coins.
- The dime has 118 reeds
- A quarter has 119 reeds
- A half dollar has 150 reeds.
The penny and nickel don’t have reeds because they were never made of precious metals.
Share Your Stories
What’s your favorite fun fact that you’ve learned about coin collecting investing? Please join the conversation and add a comment below!
Want to read more? 4 Questions for Coin Collectors
Take Three: What Tariffs, Space and Fair Trade Mean for Gold
Posted on — Leave a commentWant to make some gold? All you need are a few colliding neutron stars.

Tariffs
Call it the tariff tailspin. Trump has levied tariffs in an attempt to equalize the global trade playing field. The result: stocks plummeted. “Washington is going to dominate market action until Q1 earnings season kicks off in a few weeks,” remarked the co-founder of DataTrek Research. Meanwhile, the Volatility Index is rising as equity investors become fearful of what higher trade costs and muted growth will mean for stocks in the short-term and long-term. Their concern is well-founded; the moves could have implications for up to $60 billion of imports from China. The story for gold, however, has been different. Gold future increased 3% to $1,350 an ounce inching closer to its 52-week high of $1,362.40. “Further strength without additional dollar weakness would signal that bullion is becoming more sensitive to tariffs/trade war, and Trump’s recent cabinet replacements,” remarked an analyst with Institutional View. Additionally, silver picked up another 1.4% this week reaching $16.59 per ounce marking its highest price since March 9.
Space
Want to make some gold? All you need are a few colliding neutron stars. This was a recent scientific discovery coming from volumes of globally sourced data. In August of last year, researchers around the world made a united effort to observe a burst of gravitational waves in what one journalist calls “tiny ripples in the fabric of space.” They learned that when neutron stars crash into each other gold forms and is jettisoned into the universe. Scientist theorize that this natural phenomenon explains the origins of the precious metal on Earth. The immense force of these collisions is difficult to overstate. Each of the two colliding stars carries as much mass as the sun compressed into a sphere only slightly larger than six miles wide. “We estimate that the collision created about as much gold as the mass of the Earth,” remarked Professor Andrew Levan of Warwick University. That’s one serious pay day.
Fair Trade
Independent, non-profit organizations are leading the charge for more ethical standards in gold mining operations. They are offering certifications for companies that use both responsible working standards and pay fair wages. More jewelry manufacturers are taking note and converting their stock and production to fair trade gold only. This drive for sustainable gold has led some to delineate between traceable gold (that which can be proven to come from a certified source) and non-traceable gold. However, ensuring ethical practices carries a cost, in some cases certified gold costs an additional $4,000 per kilo. Today, fully certified mines can be found in Peru, Uganda and Kenya. As more retailers and consumers opt for fair trade the implications for all mines could be substantial given that approximately 78% of the world’s gold is turned into jewelry. For example, Swiss watch and jewelry maker Chopard has invested substantially in making their gold traceable. “The investment today will absolutely pay back in the long term,” remarked Caroline Scheufele, the co-president.
5 Surprising Facts about the Gold Standard
Posted on — Leave a commentThe history surrounding gold is centuries old. Gold coins were first struck on the order of King Croesus of Lydia, an area that is part of Turkey today. Gold coins were used long before paper money was ever introduced as a medium of exchange.

By the late 19th century, many currencies around the globe were attached to gold, or fixed at a set price per ounce. That is known as the Gold Standard.
Let’s take a quick look at the fascinating history and future of the gold standard.
- In 1971, the U.S. went off the gold standard under President Nixon. What many gold investors don’t know is that the classic gold standard that the U.S. was using included a 40% cover ratio.
What does that mean? The 40% cover ratio meant the U.S. government would only print money if it has gold in its Treasury equal to 40% of the currency in circulation. For example, if the U.S. had $10 billion of money in circulation, the 40% cover ratio meant the government had $4 billion of gold in the Treasury.
- With the current U.S. debt totaling $21 trillion, even though the U.S. has the most gold in the world, we don’t have enough gold in Fort Knox to pay off our debts.
That means a return to the gold standard is unlikely, or it would mean the government would need to “revalue” the price of gold about 400-500% higher than the current $1,350 an ounce.
- Economists say a return to the gold standard would choke off economic growth.
Modern finance includes the concept of a “growing money supply.” The Federal Reserve can flip the switch and print more dollars, just like the “quantitative easing” efforts that were seen in the wake of the 2008 Global Financial Crisis. You can’t print more gold. Money supply couldn’t grow faster than the supply of gold, which could force lending and economic growth to slow down, some economists say.
- All other countries of the world would need to join in too.
Many financial experts say a return to the gold standard could only work if other advanced nations did it too. Given the difficulty agreeing on trade issues alone, a global monetary agreement to the gold standard appears unlikely at current times.
- Gold is expected to continue to play a key monetary role in the future.
While advanced industrial economies continue to degrade the value of their paper money by money printing and deficit spending, there has been discussion about an eventual “basket” of currencies that could someday become the new world reserve currency and replace the dollar. Gold would play a key part in that currency basket, financial experts say.
The Bottom Line
While a return to the gold standard appears unlikely in our modern financial era. That in no way takes away the inherent power and value of owning physical gold. To the contrary, it only enhances the intrinsic value of gold – as an asset that can’t be degraded by a government printing press.
Gold is a traditional currency that is recognized as a store of value around the world.
Why else would countries from the U.S. to Germany to Italy to China to Russia to Japan to India and dozens more hold hundreds of tons of gold in their central bank vaults?
Owning gold is an appropriate investor for all investors. A properly diversified portfolio can include anywhere from 10 to 25% of gold, depending on your financial goals. If you haven’t developed a financial investing plan, call Blanchard to get started with an individualized financial consultation. Blanchard has a long history of helping individual investors hedge their assets and grow their wealth. You can get started with investments as small as $380 for a 1/4 ounce American Eagle coin, all the way up to rare coins in the thousands. No matter your budget or your financial goals, we can help you too.


